Workshop Cartografie in 
Beyond Bertin
Niene Boeijen
This presentation and materials:
github.com/NieneB/qgis-cartografie
Even voorstellen..

We make interactive maps and visualizations.
Alles open source!
Onze expertise is open {source; data; standaarden}.
Doel van deze 2,5 uur
Tool voor vandaag:
kenmerken
- Static
- Zoom level dependent
- Print?
Cartografie?!
- Grafisch & Cartografisch ontwerp
- UX design
- Film tropes storytelling concepten
- Gestalt
Inhoud
- Gegevenseigenschappen
- Grafische variabelen
- Tropes
- Gestalt
- Map components
daarna zelf aan de slag!
Theorie naast Qgis functionaliteit
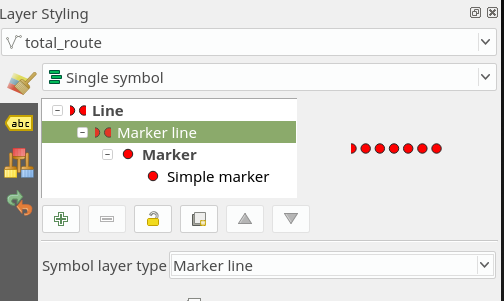
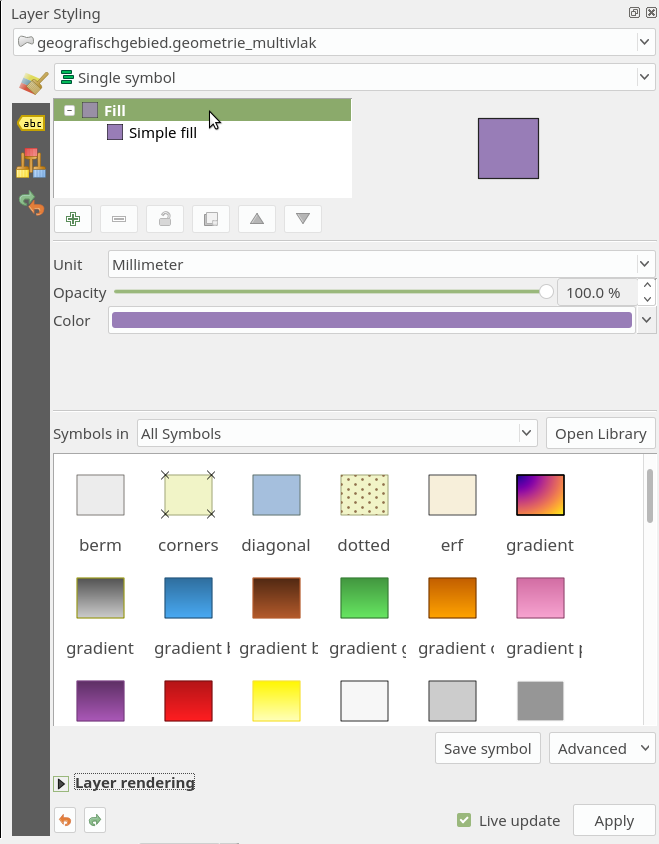
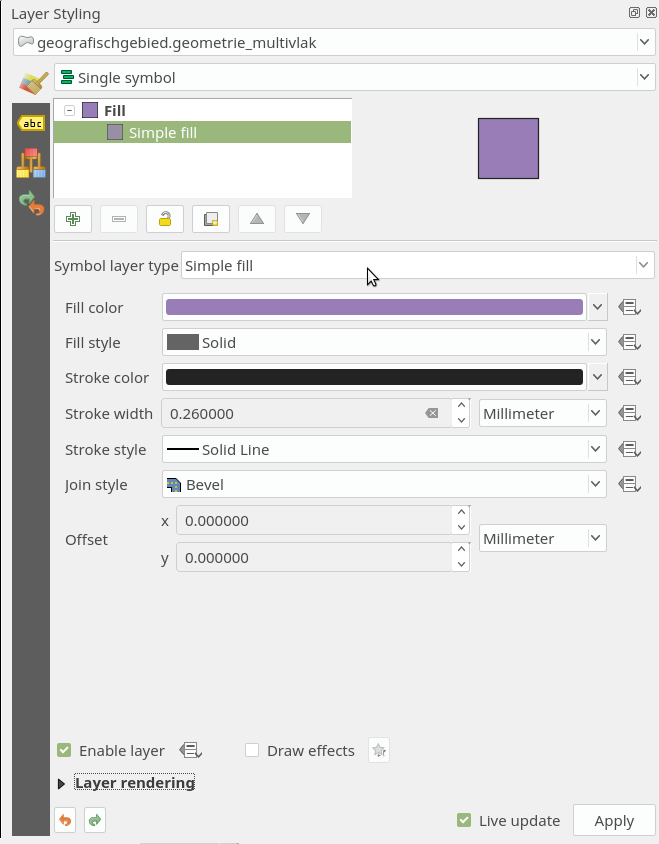
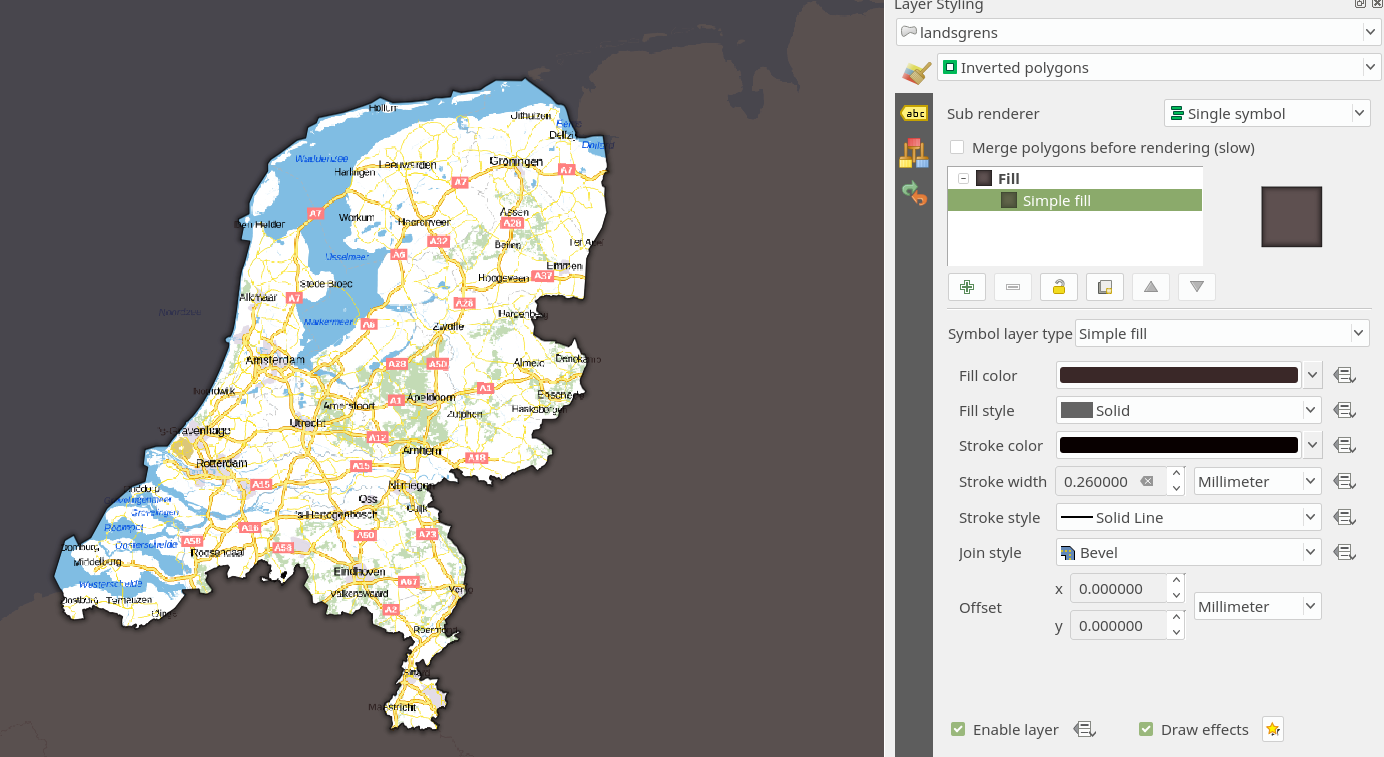
In Qgis 3! Layer Styling Panel!!
Zet het vast klaar
View >> Panels >> Layer Styling Panel
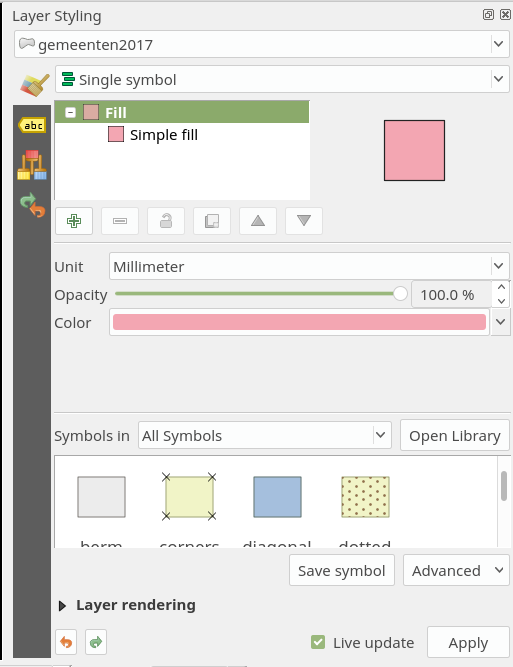

Stijl opties
Label opties
Stijl opslaan
Undo
Gegevenseigenschappen
- Punt
- Lijn
- Polygoon
- Raster
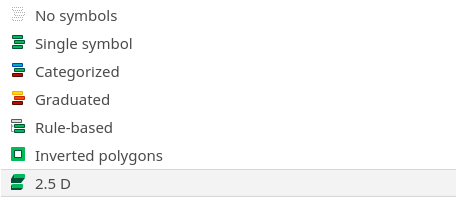
Polygoon
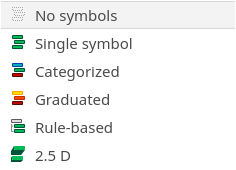
Lijn
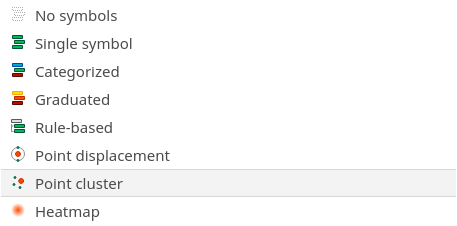
Punt
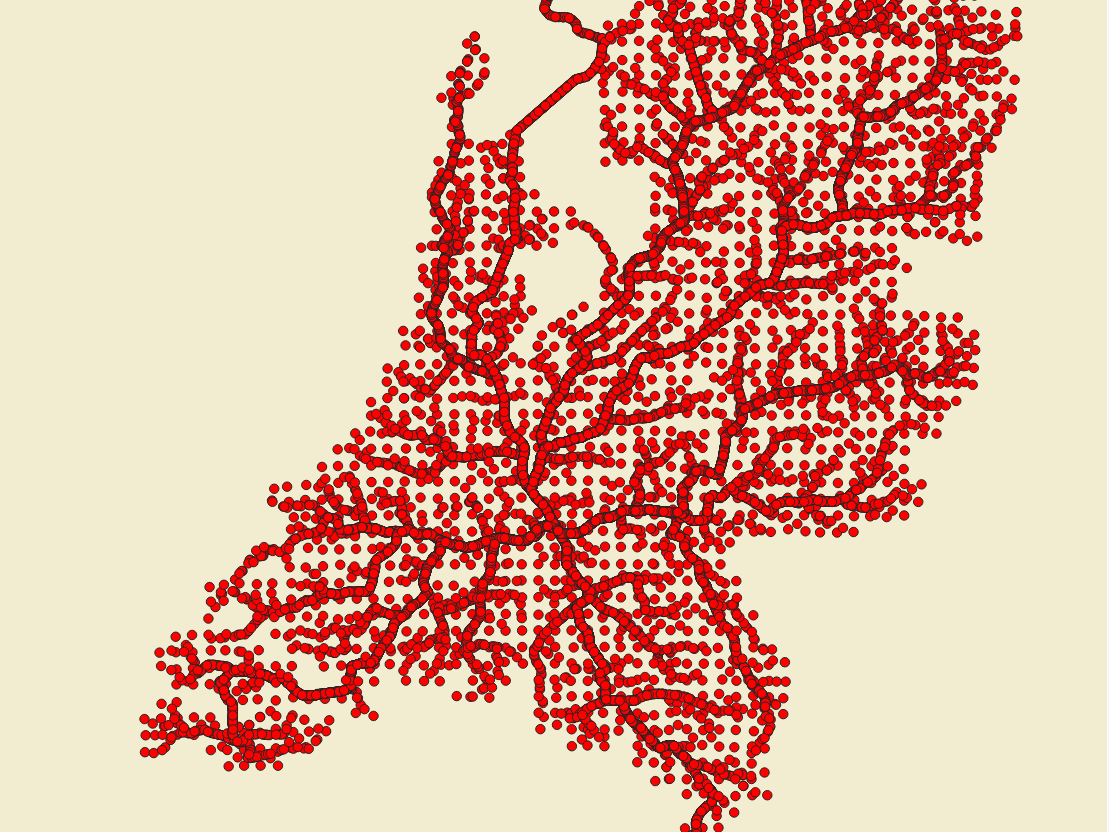
Een polygoon hoeft geen polygoon te zijn, een lijn geen lijn, een punt geen punt...
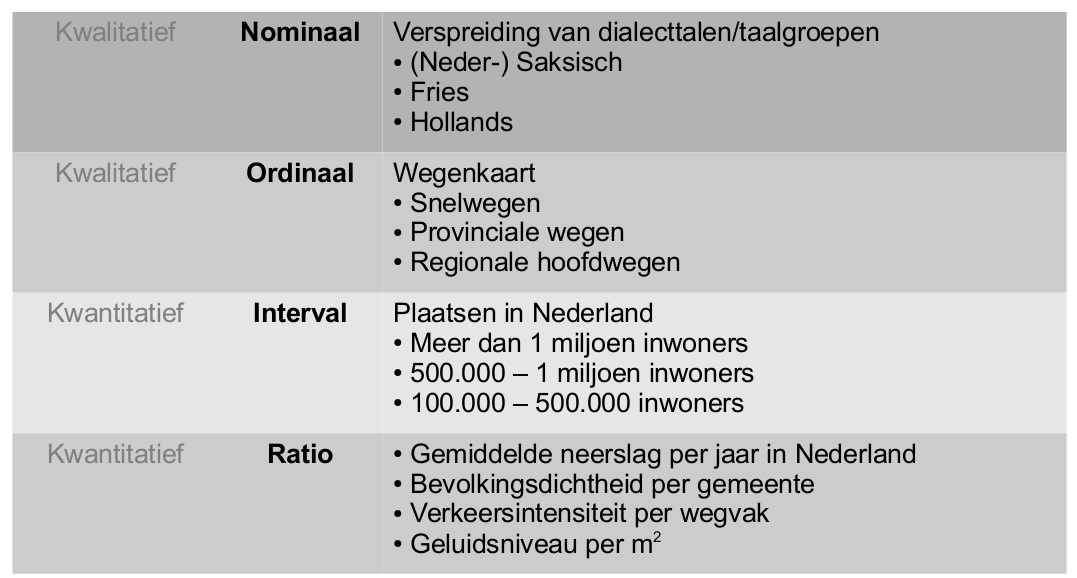
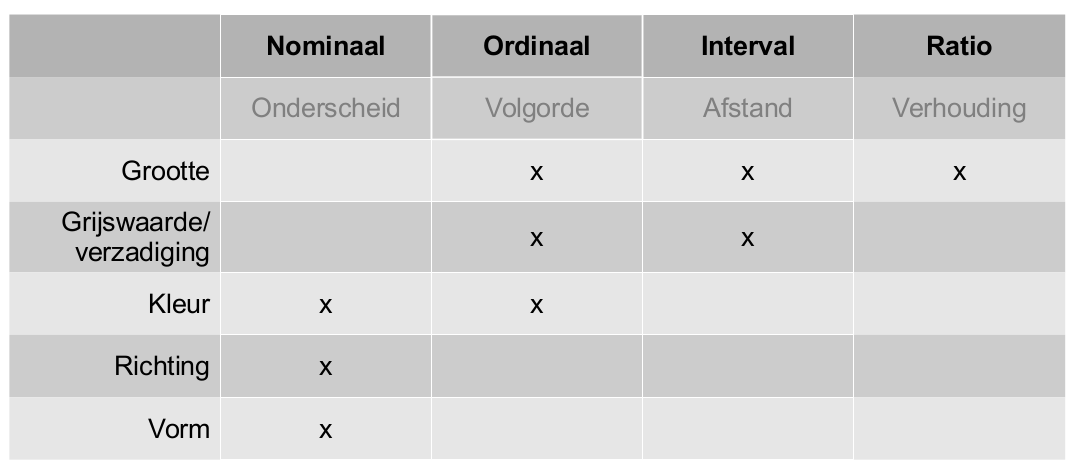
Meetniveaus
-
Kwalitatief
- Nominaal
- Ordinaal
-
Kwantitatief
- Interval
- Ratio
polygon
lijn
punt
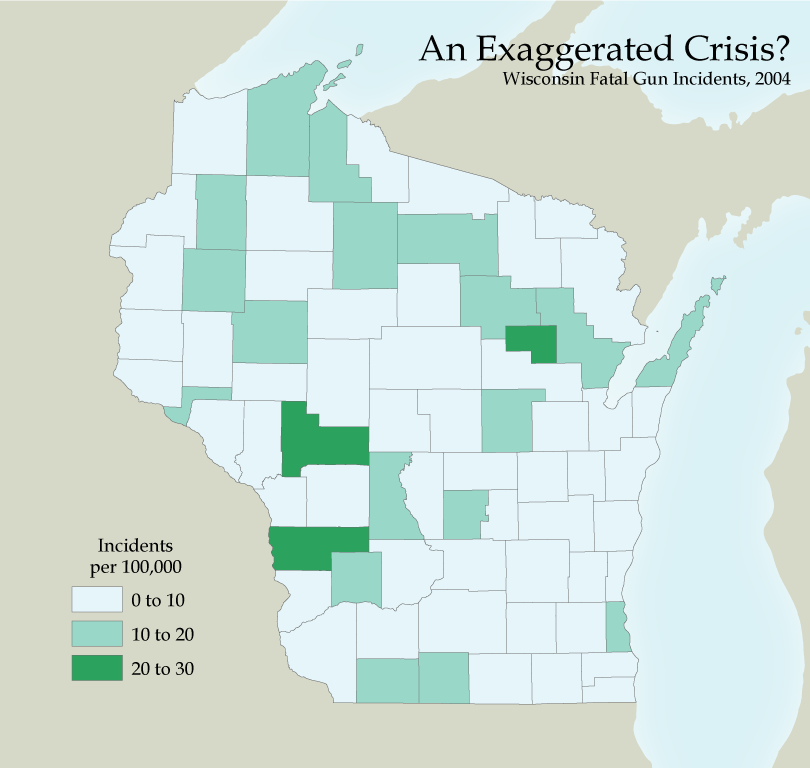
Data Classification
- Equal Intervals
- Quantiles (equal counts)
- Standard deviation
- Natural Breaks (jenks)
- Pretty Breaks
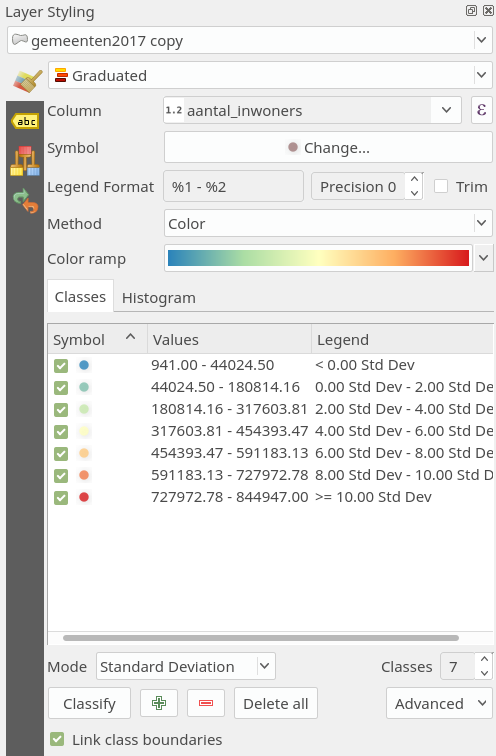
van ratio terugbrengen naar interval
Visuele Variabelen
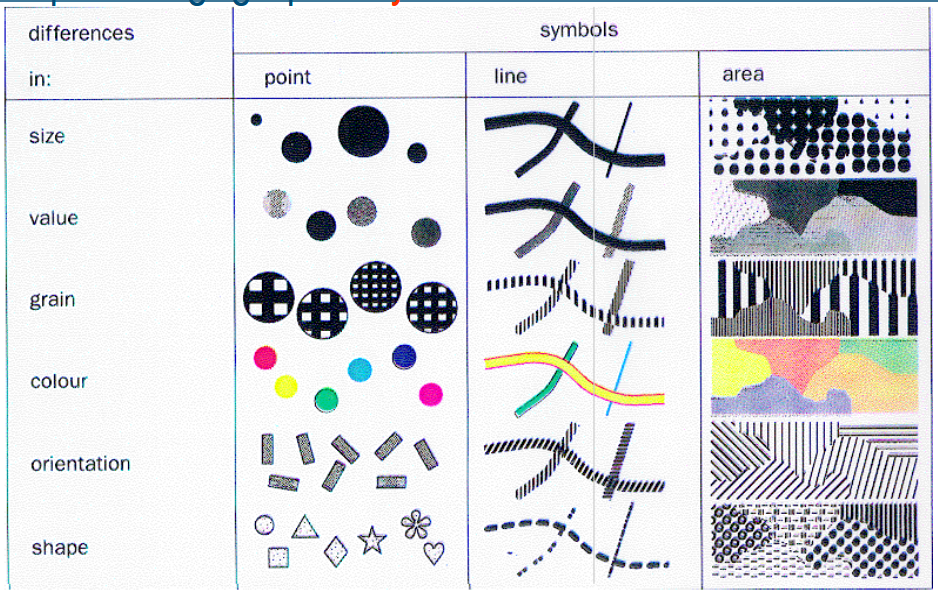
- Grootte
- Verzadiging
- Kleur
- Richting
- Vorm
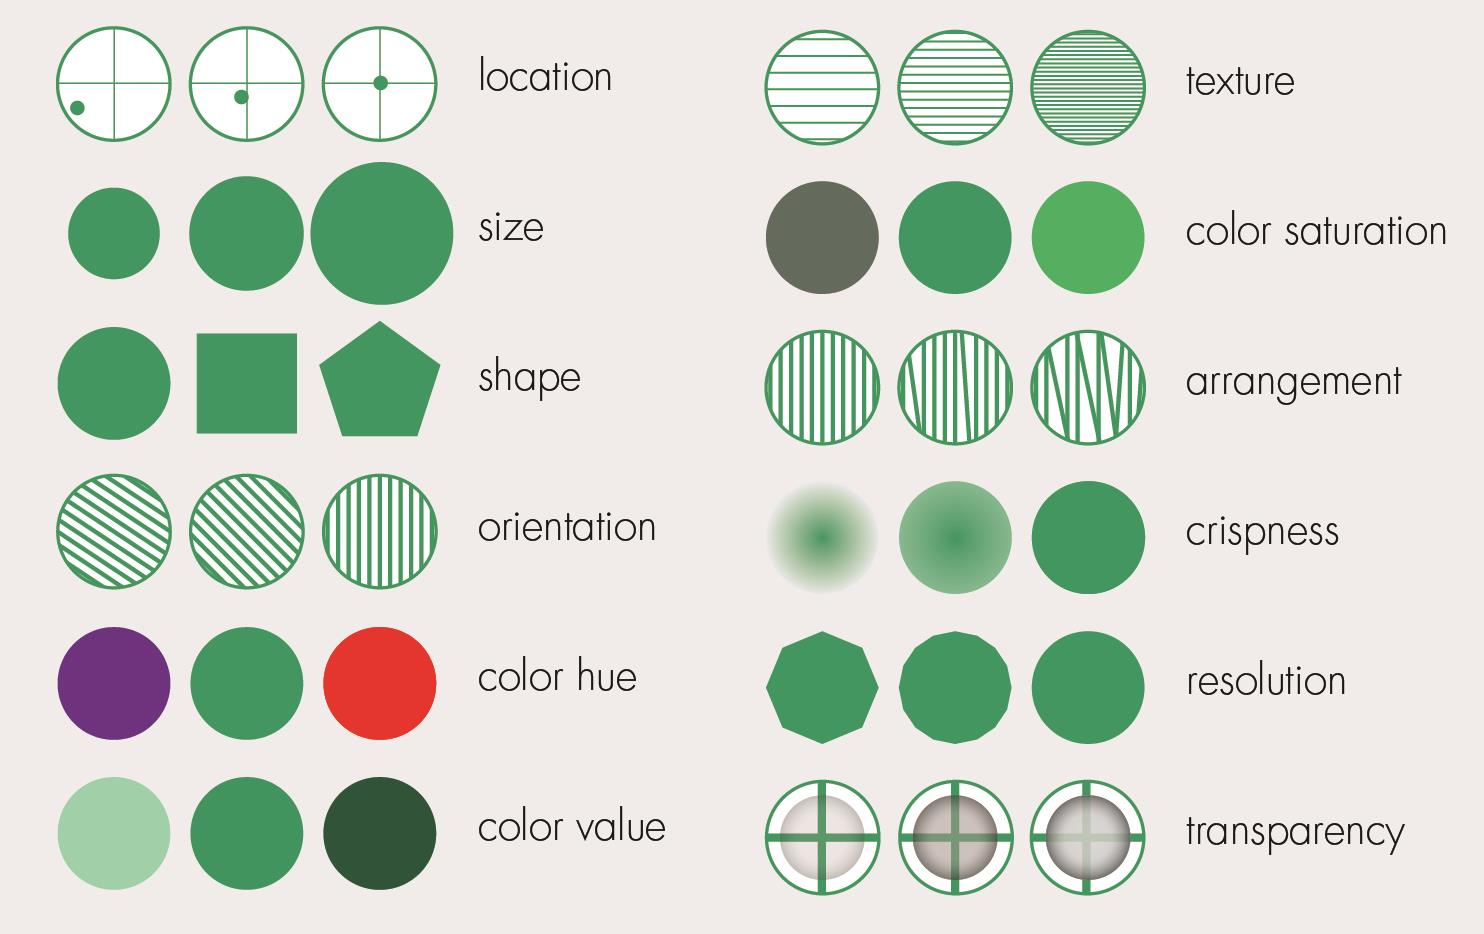
Visual variables for uncertainty
- Clarity
- Crispness
- Resolution , Focus/onscherpte
- Transparantie
- Schaduw
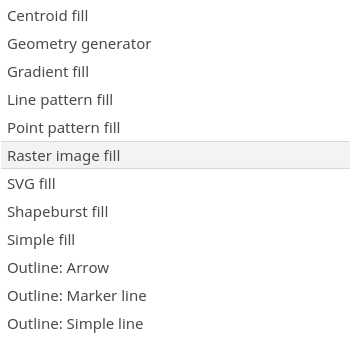
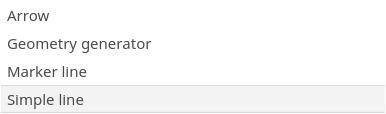
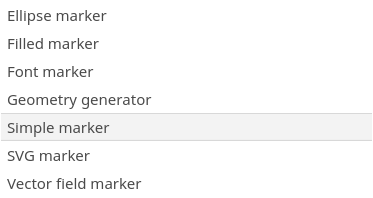
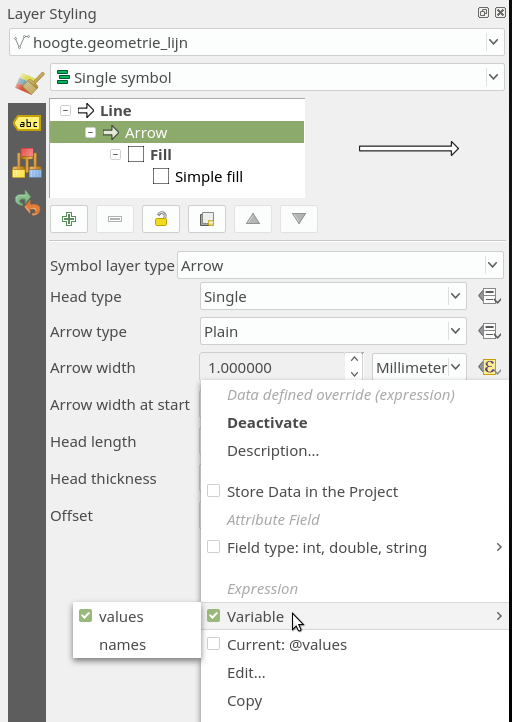
In Qgis... zo veel opties
- Type grafische variable
- Specificaties
- Effecten
- Transparantie
- Per feature OF op de layer!!
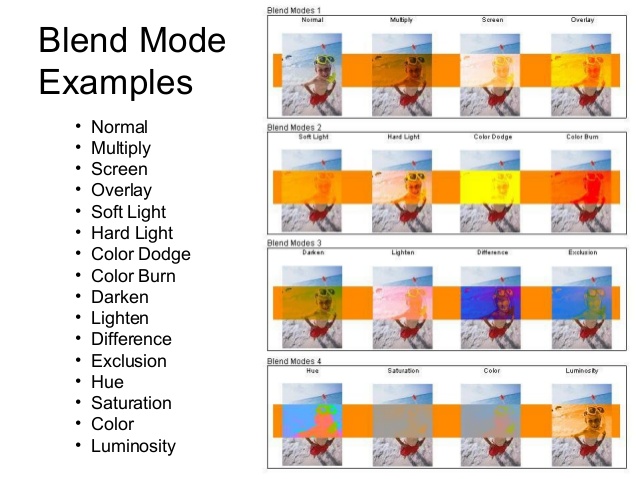
Effecten? Meer dan Bertin!

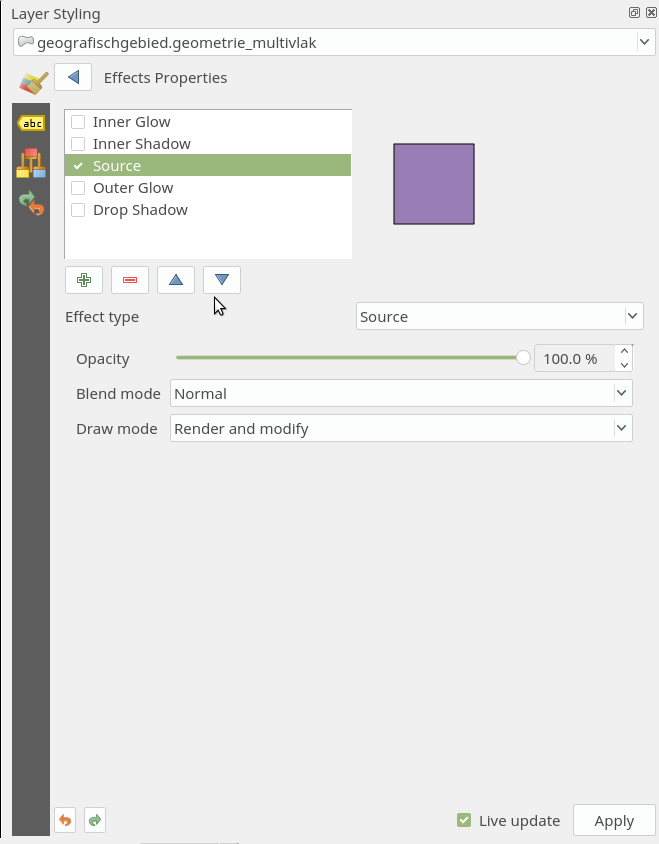
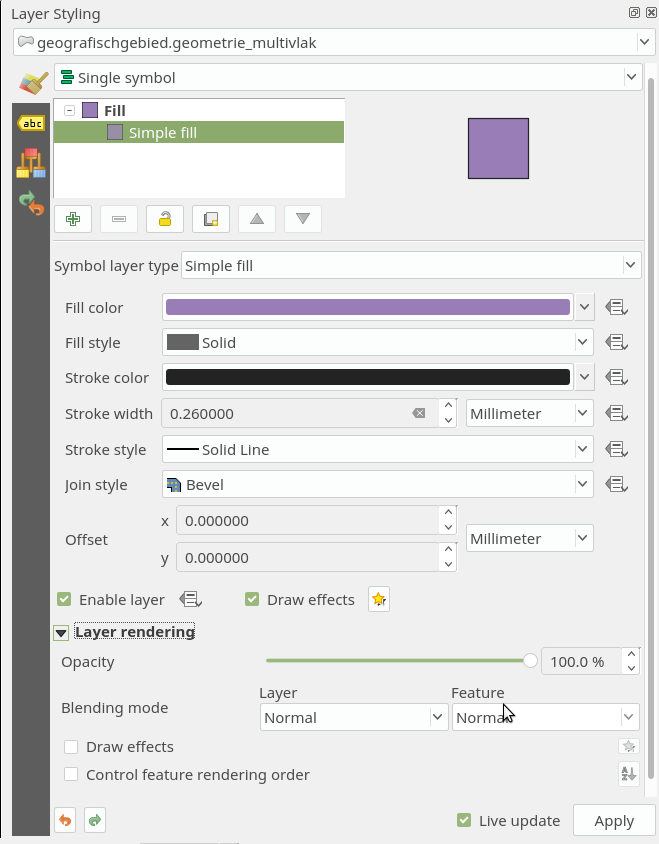
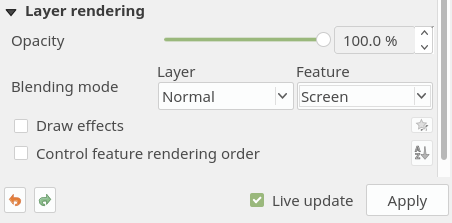
Blend modes
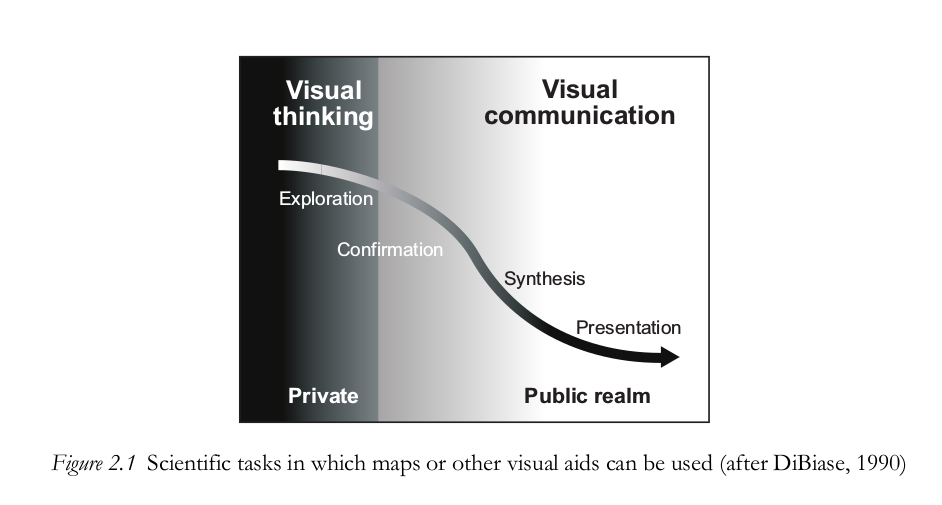
Gestalt & Tropes
Tropes
Literature/films
how the story advances
- Linearity
- Set the mood
- Dosing
- Attention
- Redundancy
- Methaphor
- Voice
Linearity
Dosing
reduce complexity into a set of immediately understandable chunks of information
Set the mood
Setting theme characters
Voice
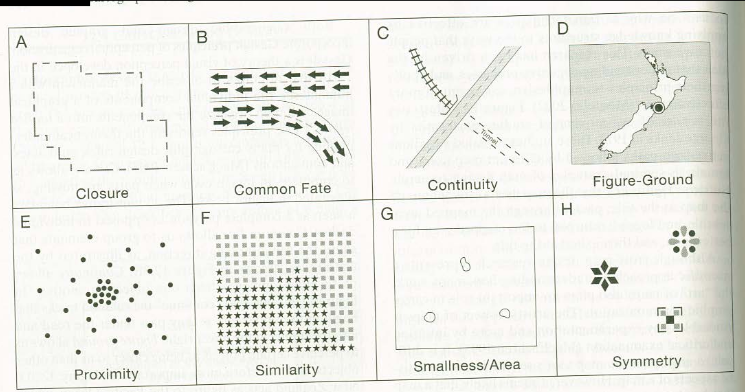
Gestalt
an organized whole that is perceived as more than the sum of its parts
How humans see individual components of a graphical image, then organize into a universal whole
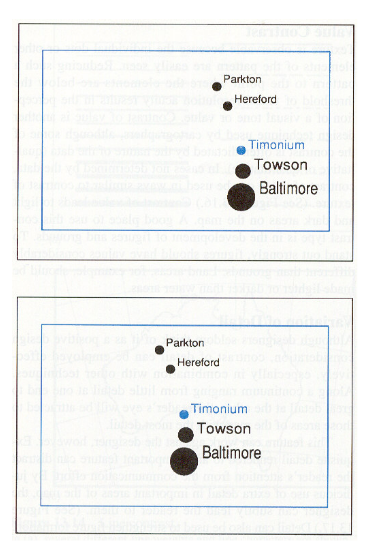
- Balance
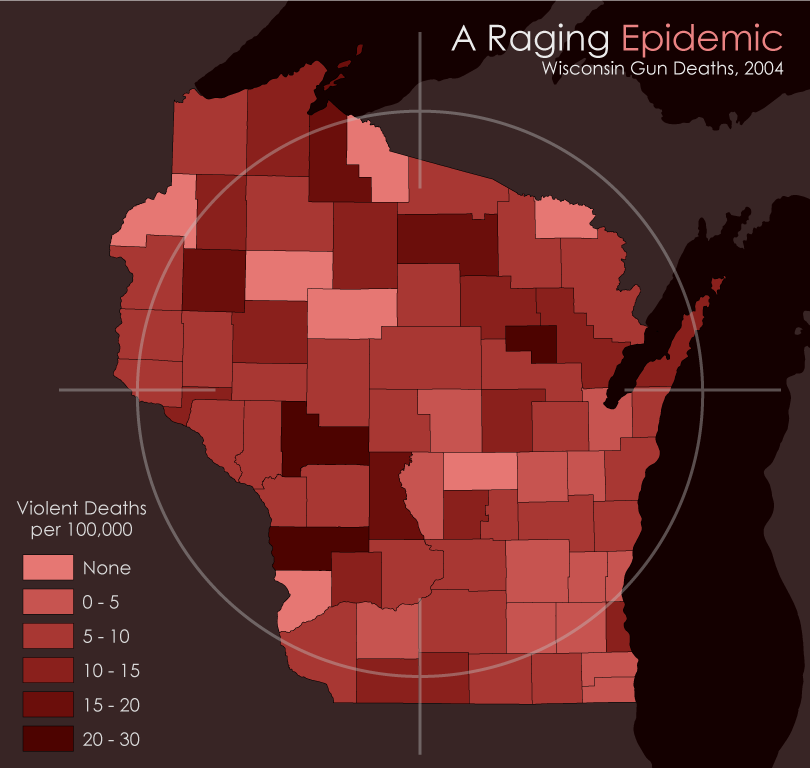
- Visual contrast
- Visual hierarchial organization
- Figure ground
- Proximity
- Focus of attention
Focus of Attention
Legibility
Legibility is “the ability to be seen and understood”.
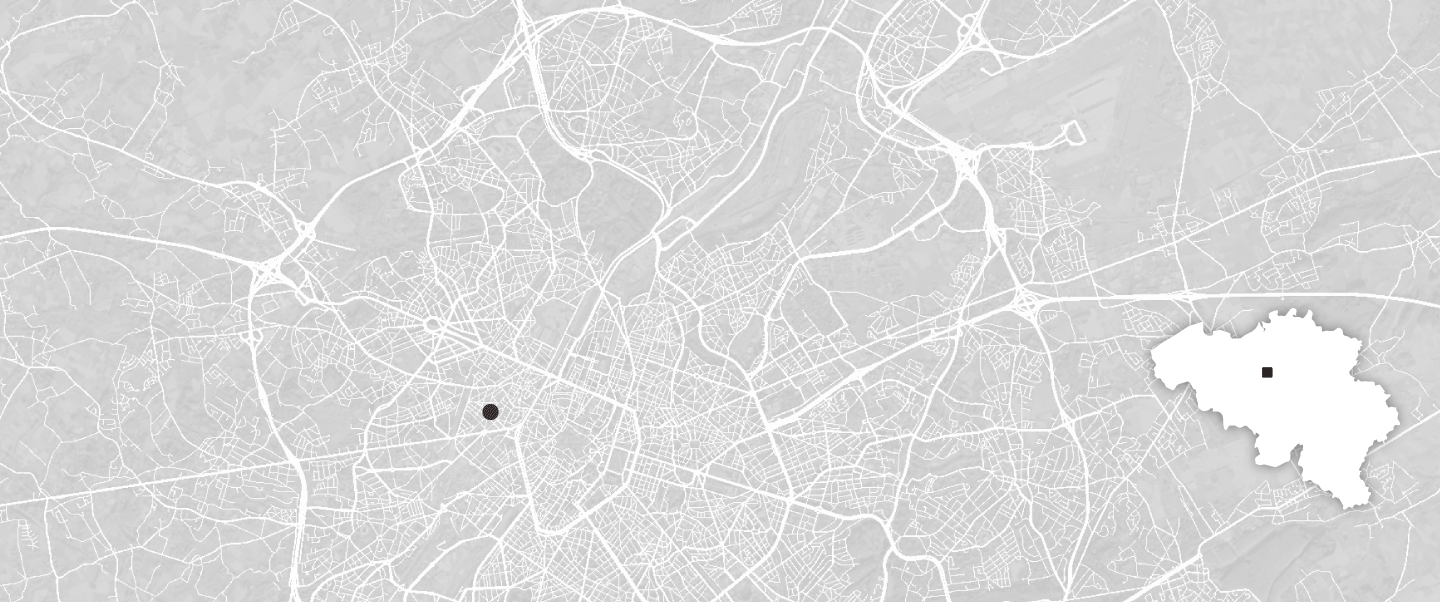
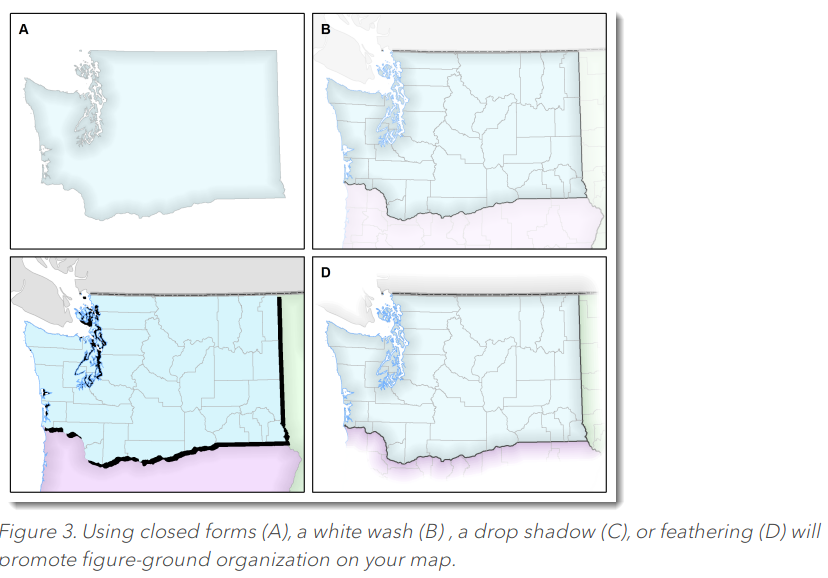
Figure ground
the spontaneous separation of the figure in the foreground from an “amorphous” background.
Connection
Balance
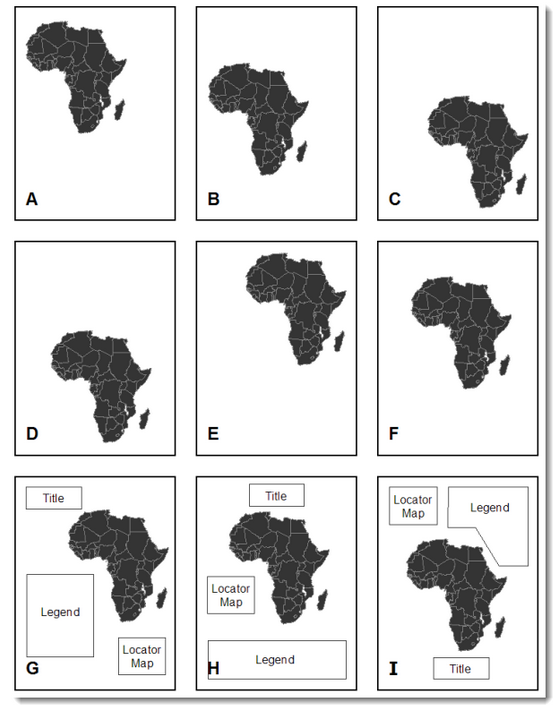
Map Components
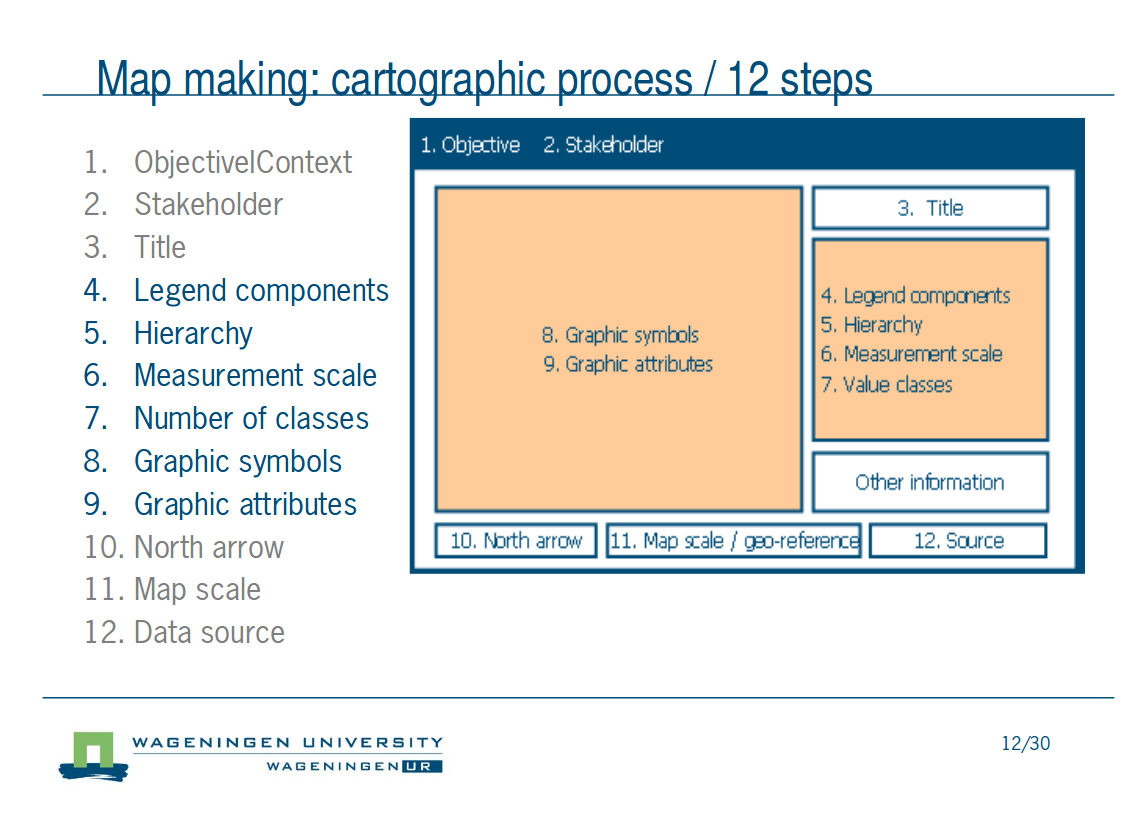
Print composer >> Print Layout
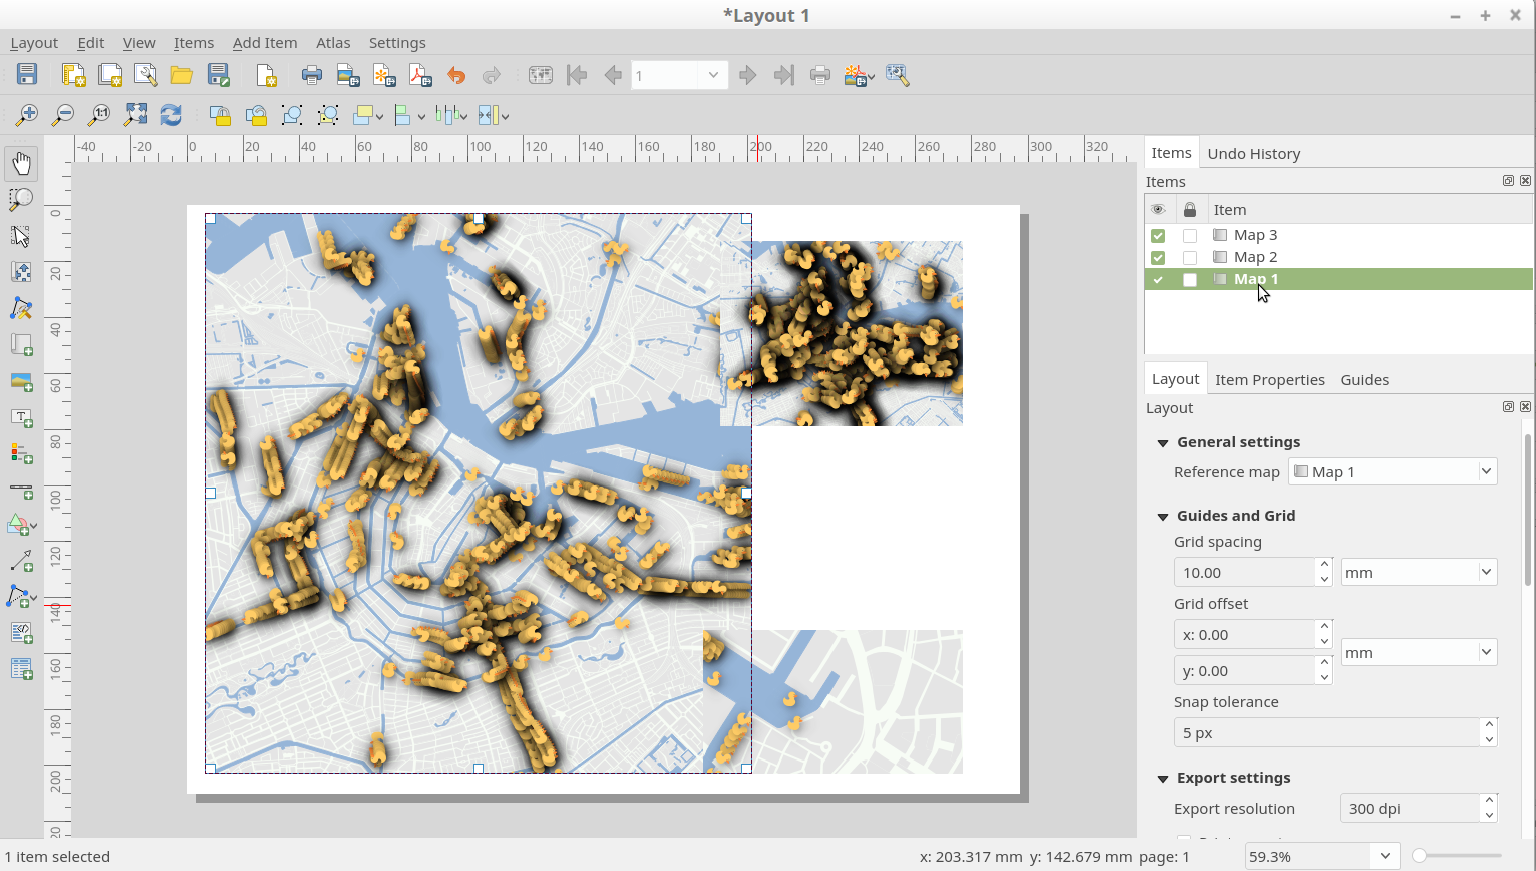
Move item vs Move item content
Ordering items
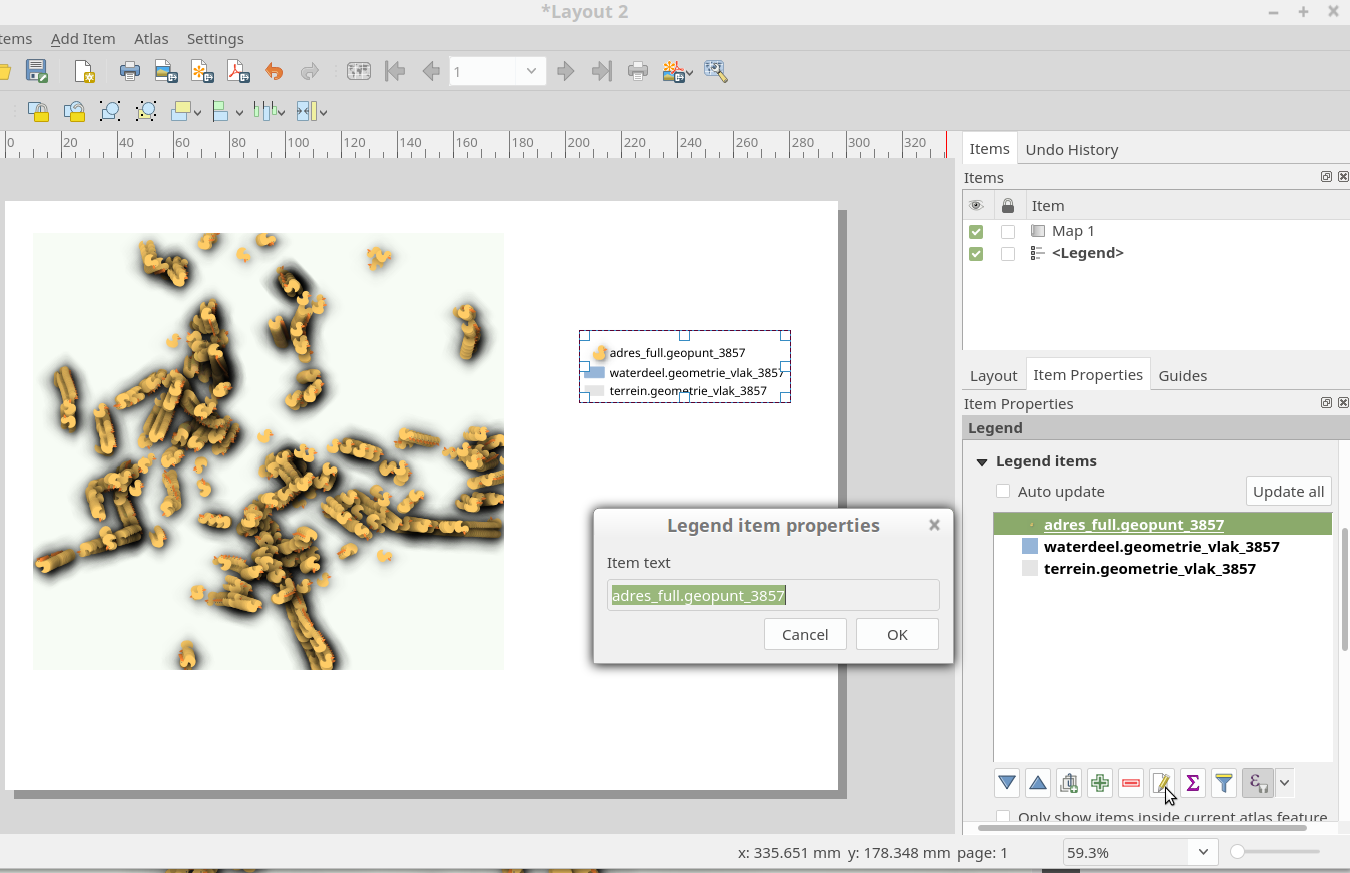
Item Properties

Insets, mood, linearity, connection
story telling!
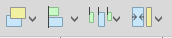
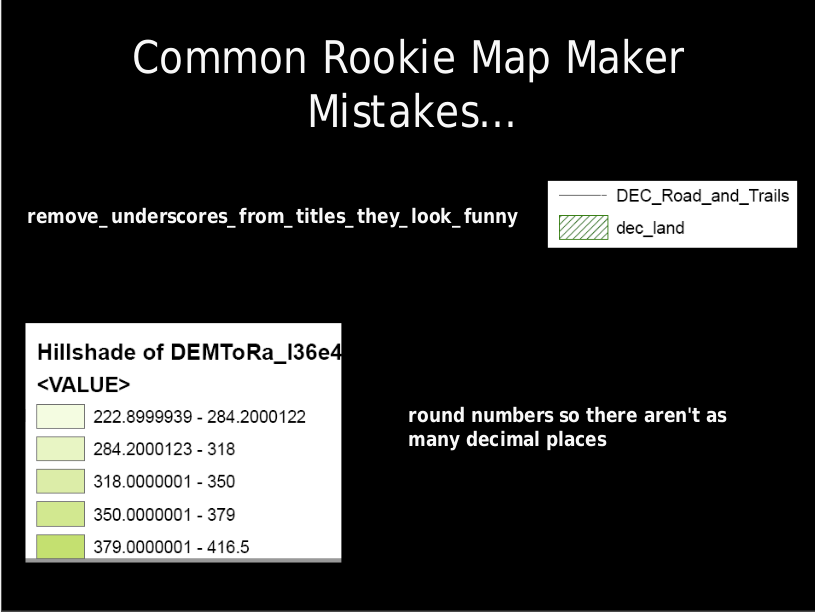
legend, watch the defaults!
Aan de slag!
Doel: gebruik zo veel mogelijk opties in Qgis maar blijf bedenken wat het doet voor je cartografische weergave!

Paar tips!
1. Gebruik Géén Defaults!
2. Een kaart is méér dan alleen de kaart. Alles eromheen verteld ook het verhaal.
3. Een polygoon hoeft geen polygoon te zijn, een lijn geen lijn, een punt geen punt...
4. Ben creatief! Probeer eens wat anders.
5. Error & trial
github.com/NieneB/qgis-cartografie
Vragen?
niene@webmapper.net
thanks to
- Roth
- Edward Macgillavry
- https://www.esri.com/arcgis-blog/products/product/mapping/design-principles-for-cartography/
- https://www.gridd.nl/en/2016/05/apply-gestalt-principles-ux-design/
- https://www.axismaps.com/guide/general/visual-variables/