Maps on the Web!
Presentatie en workshop voor Provincie Zuid-Holland
Door: Niene Boeijen
Deze presentatie en workshop materialen:
www.github.com/NieneB/pzh_web_map
Wie ben ik?


We make interactive maps and visualizations.
TOP team
Waarom deze workshop?

Wat gaan we doen vandaag?
- Geo data
- Projecties en coördinaat systemen!?
- Geo data naar het Web
- Tiles
- WMS en WFS
- Tools en technieken
- Hands on! Workshop zelf een web map maken met Leaflet.js of ArcGIS JavaScript API
- Afsluiting met Web Frameworks en toekomst web van web maps
Doel workshop
Aan het einde van deze workshop heb je je eigen werkende web pagina met een interactieve kaart. De kaart bevat de officiële Nederlandse achtergrondkaart van PDOK én een WMS laag van GIS afdeling. Dit allemaal in de Nederlandse RijksDriekhoekstelsel projectie.

Beginners

Je hebt geen uitgebreide voorkennis nodig van JavaScript, HTML, CSS, Leaflet.js, de ArcGIS JavaScript API of WMS en WFS servers. Deze workshop helpt je met de eerste kennismaking hiervan.
Laten we beginnen!
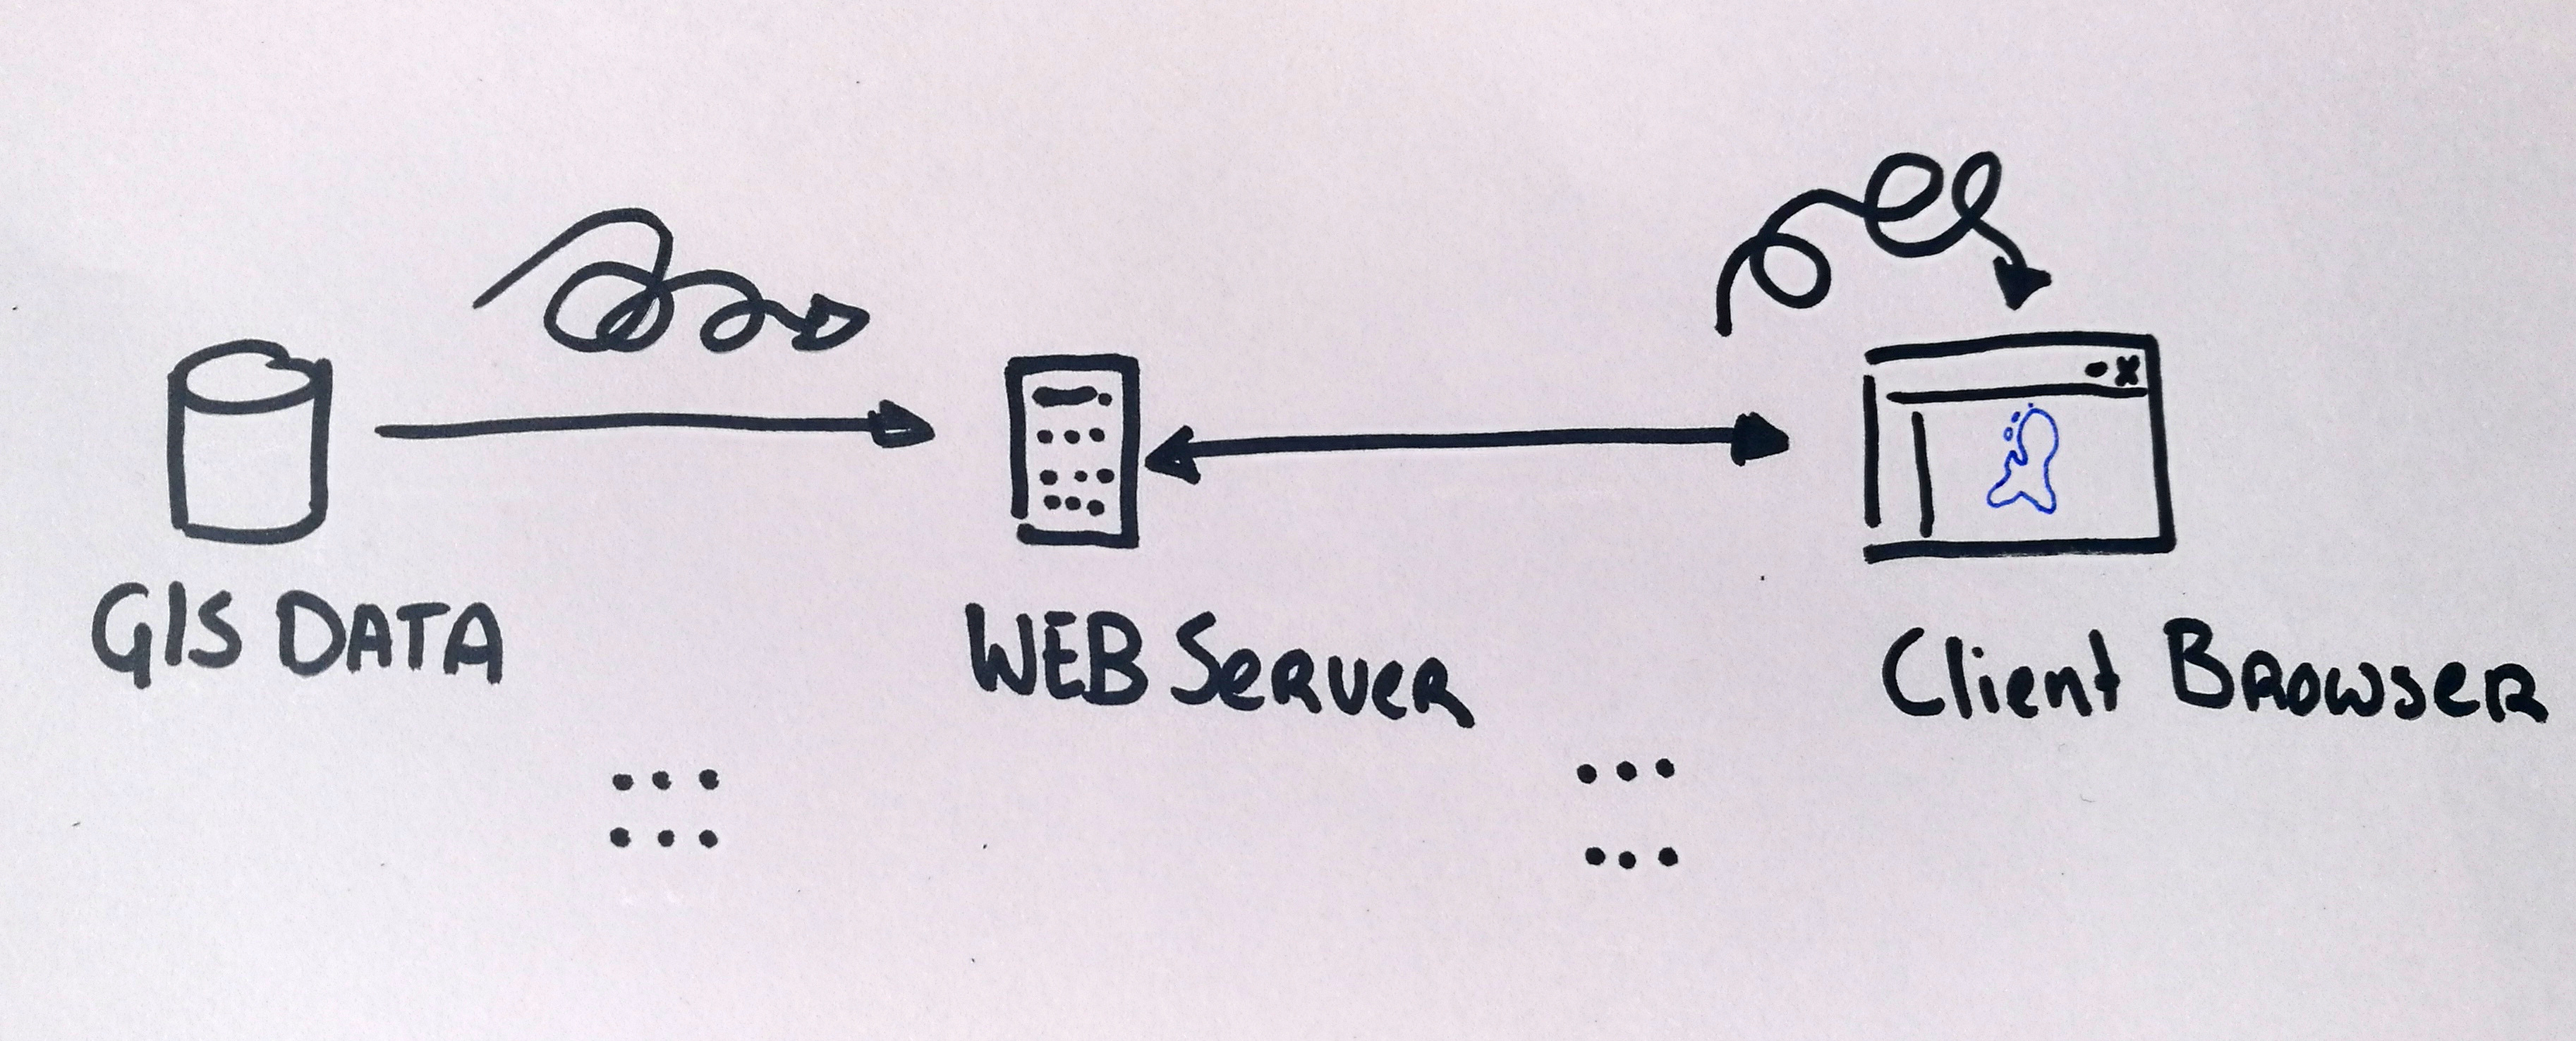
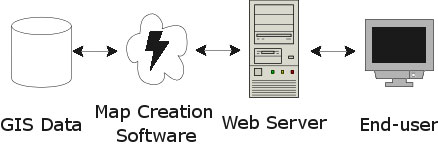
Het Web Map Universum!
GeoData van Desktop naar het Web
Doel >> Functionaliteit >> Mapping Technologie >> Design
Doel?
Veel manieren om geo-data op het web te krijgen!
- Interactieve/statische web map
- Web GIS applicatie
- WMS/WFS
- Download link
- Animated, real time
- Collaborative web maps
- Online atlasses
- Infographic, plaatje, video, gif
- Hoeveelheid data
- Benodigde interactie
- apparaat
- Online/offline
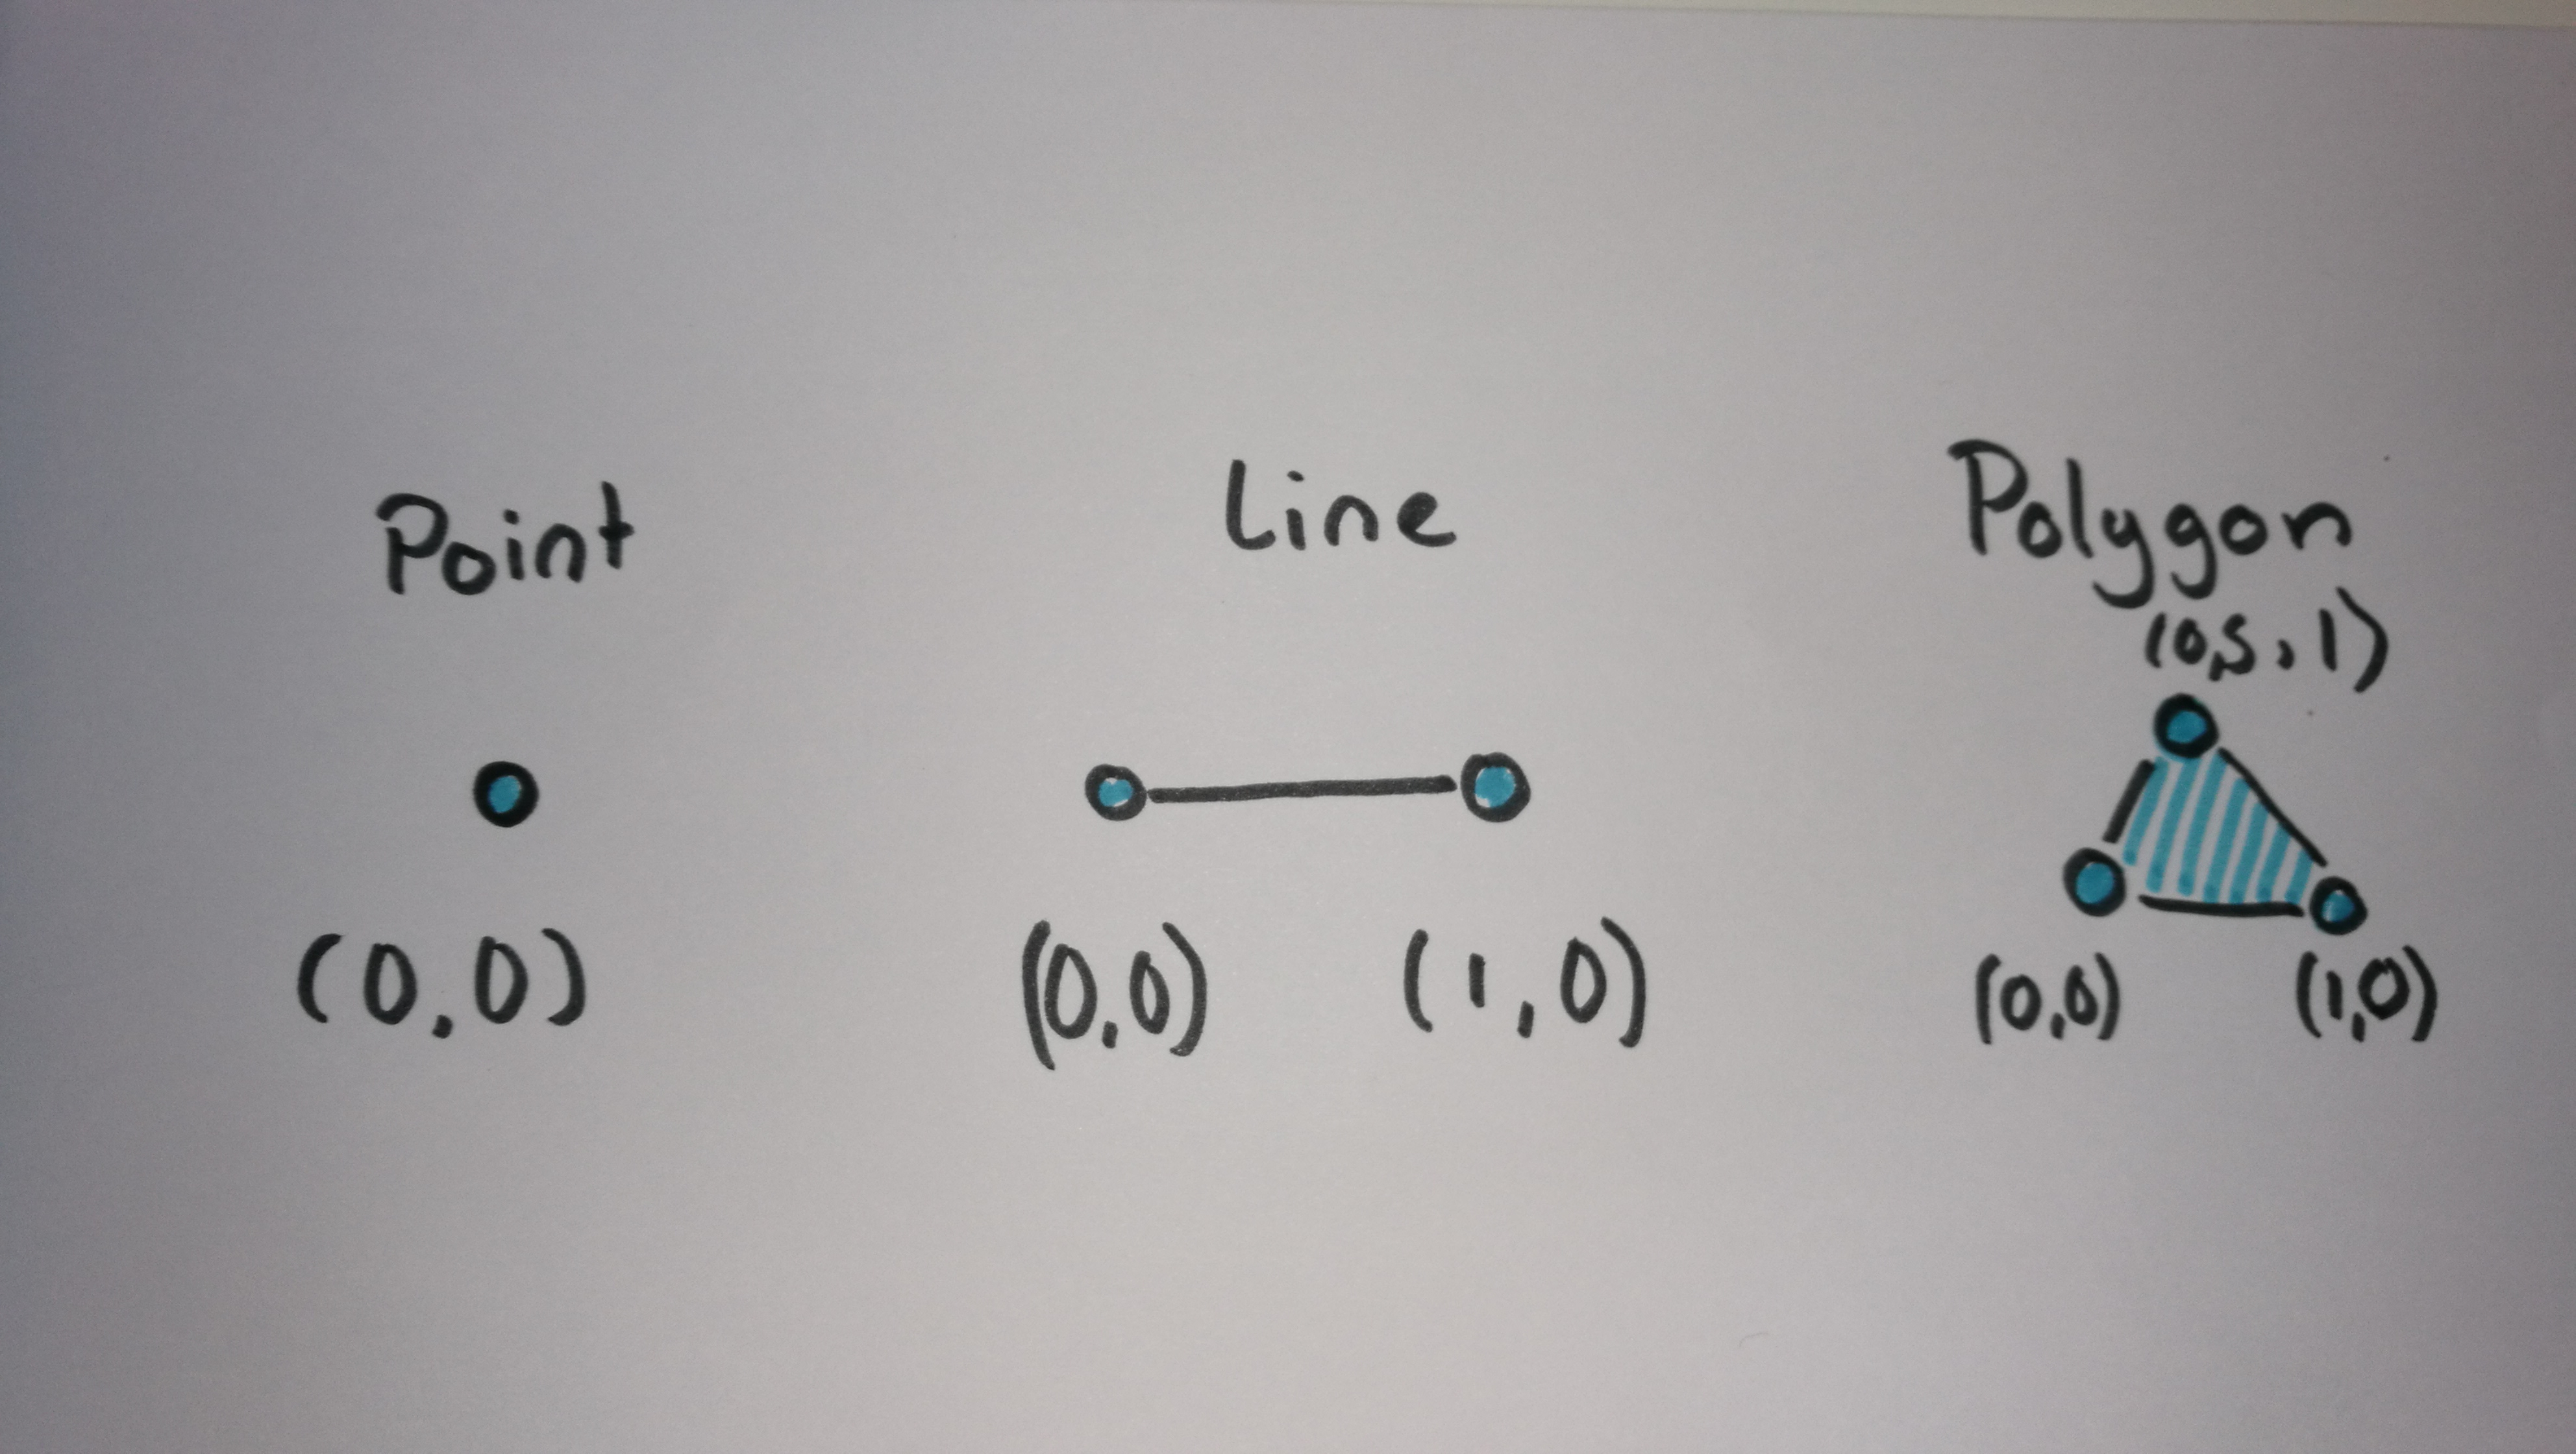
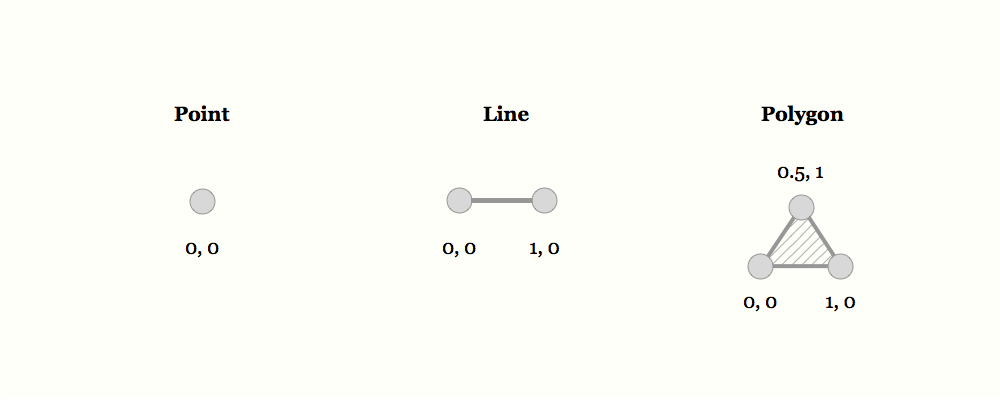
Geo Data = Data + Location
Vector vs Raster
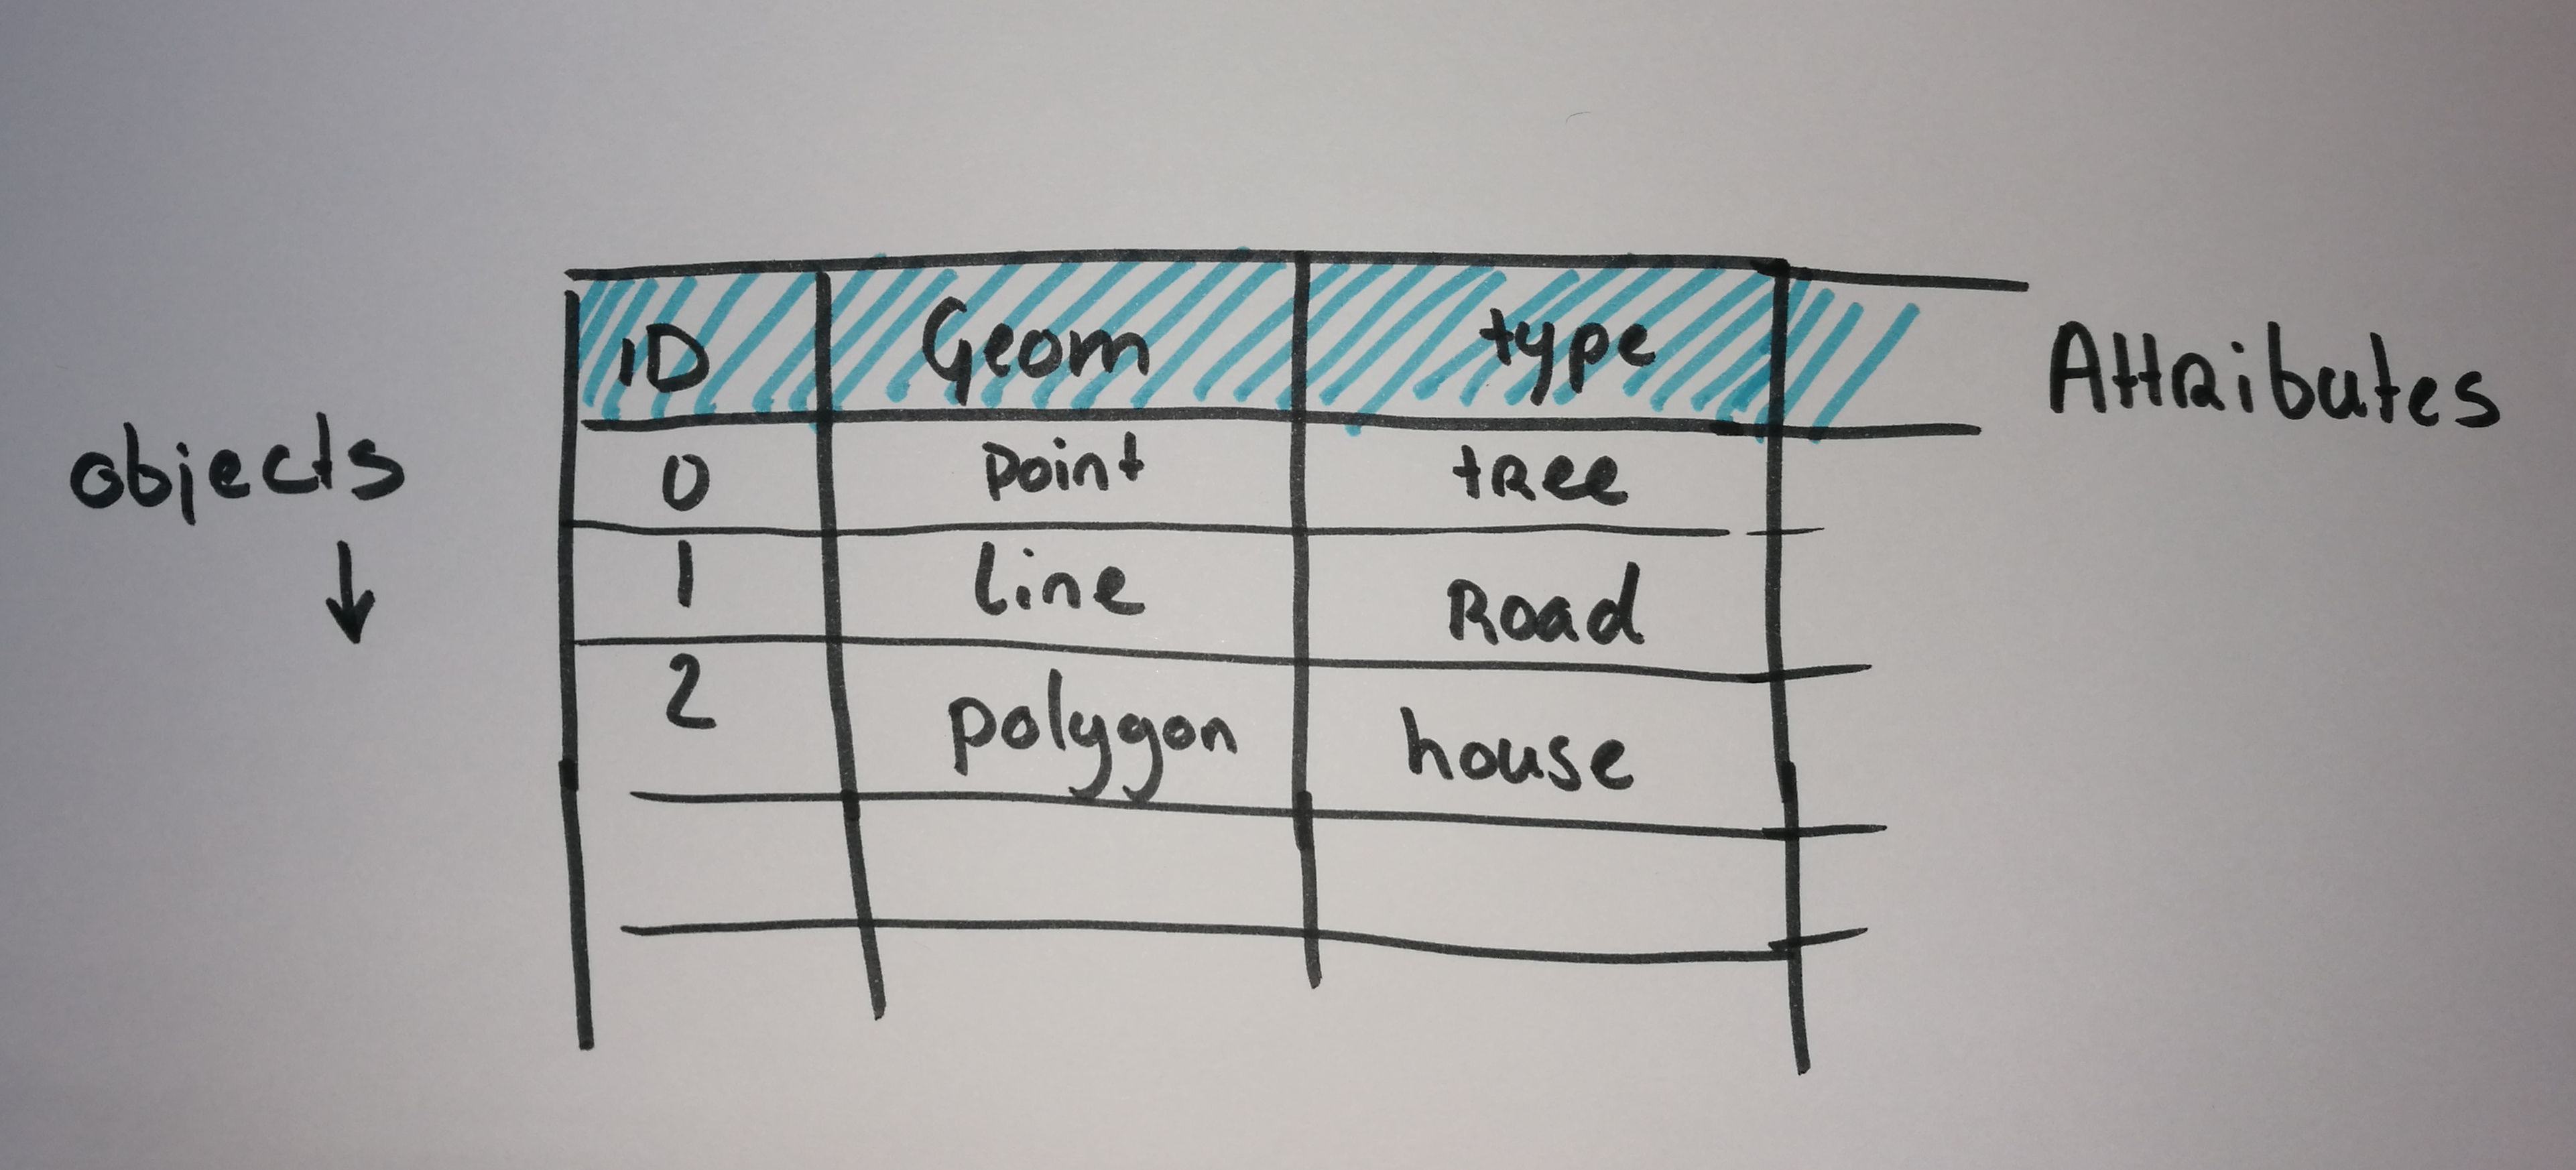
Maps = Collection of Geo data
Maps organize complex data about the environment.
Reveal patterns and relationships.
Maps allow us to communicate about location using a common framework
Coordinate system
Communicate locations & distances on the Earth's surface
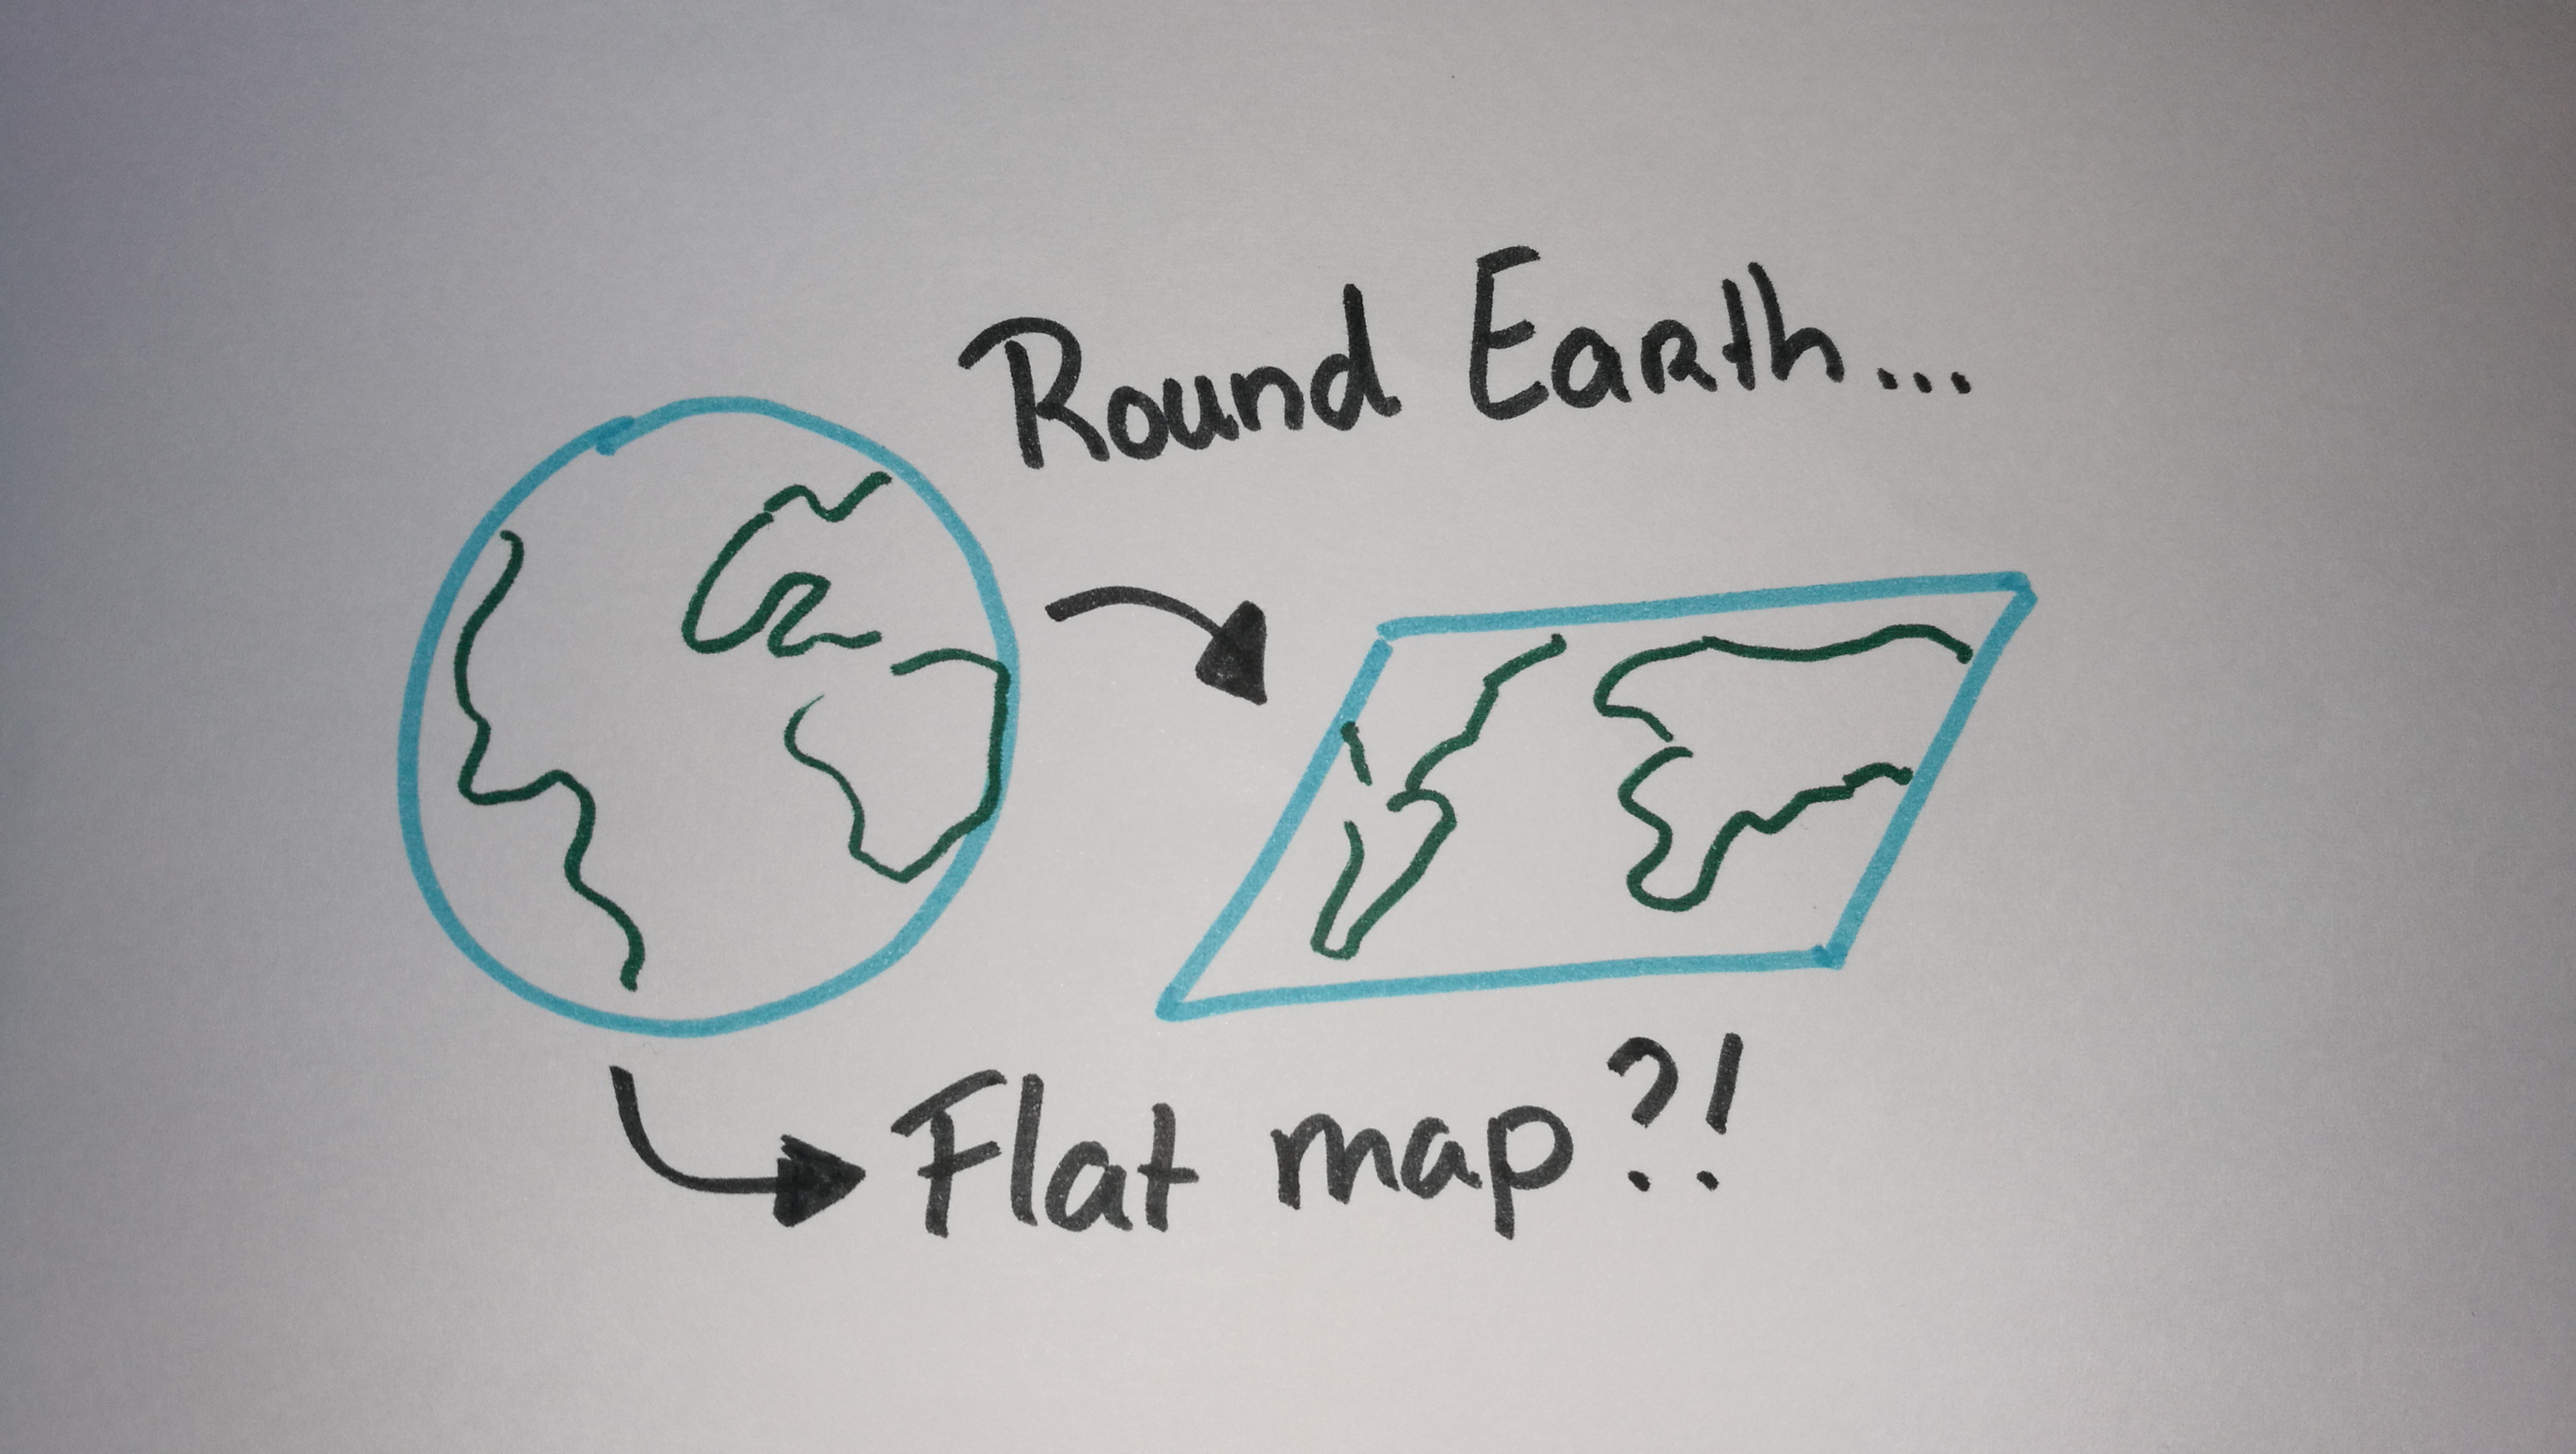
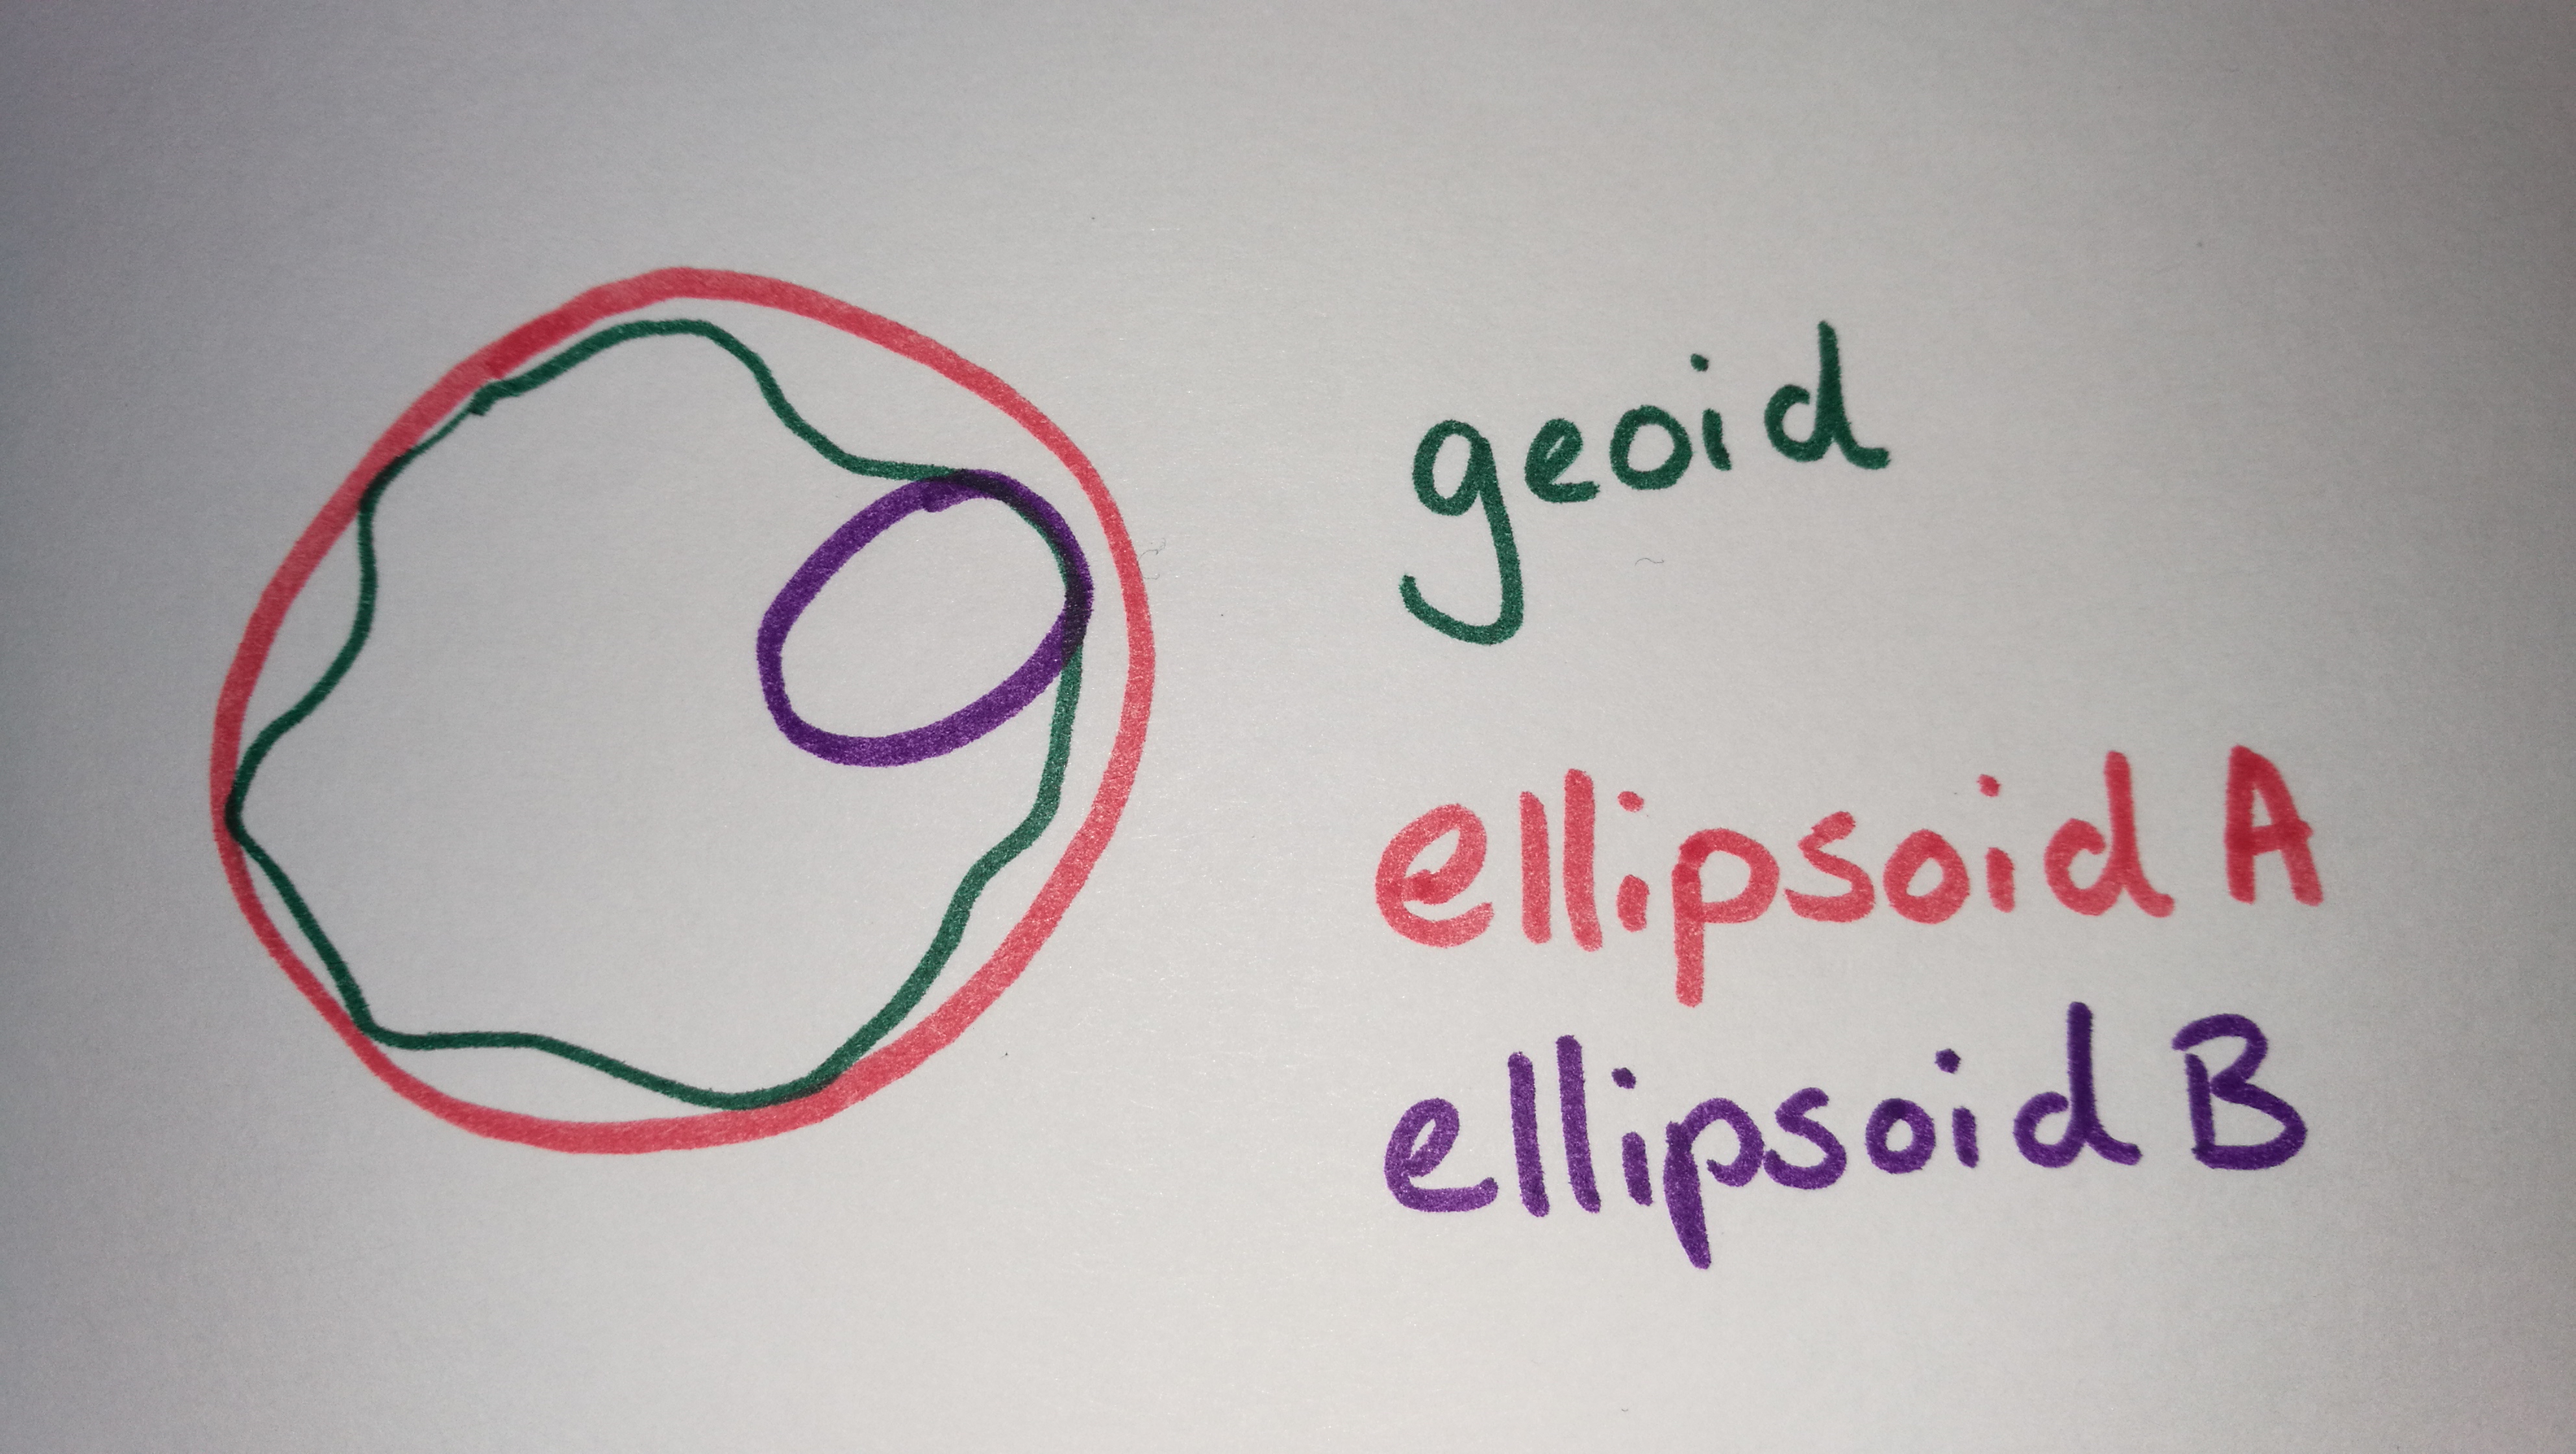
Shape of the earth?
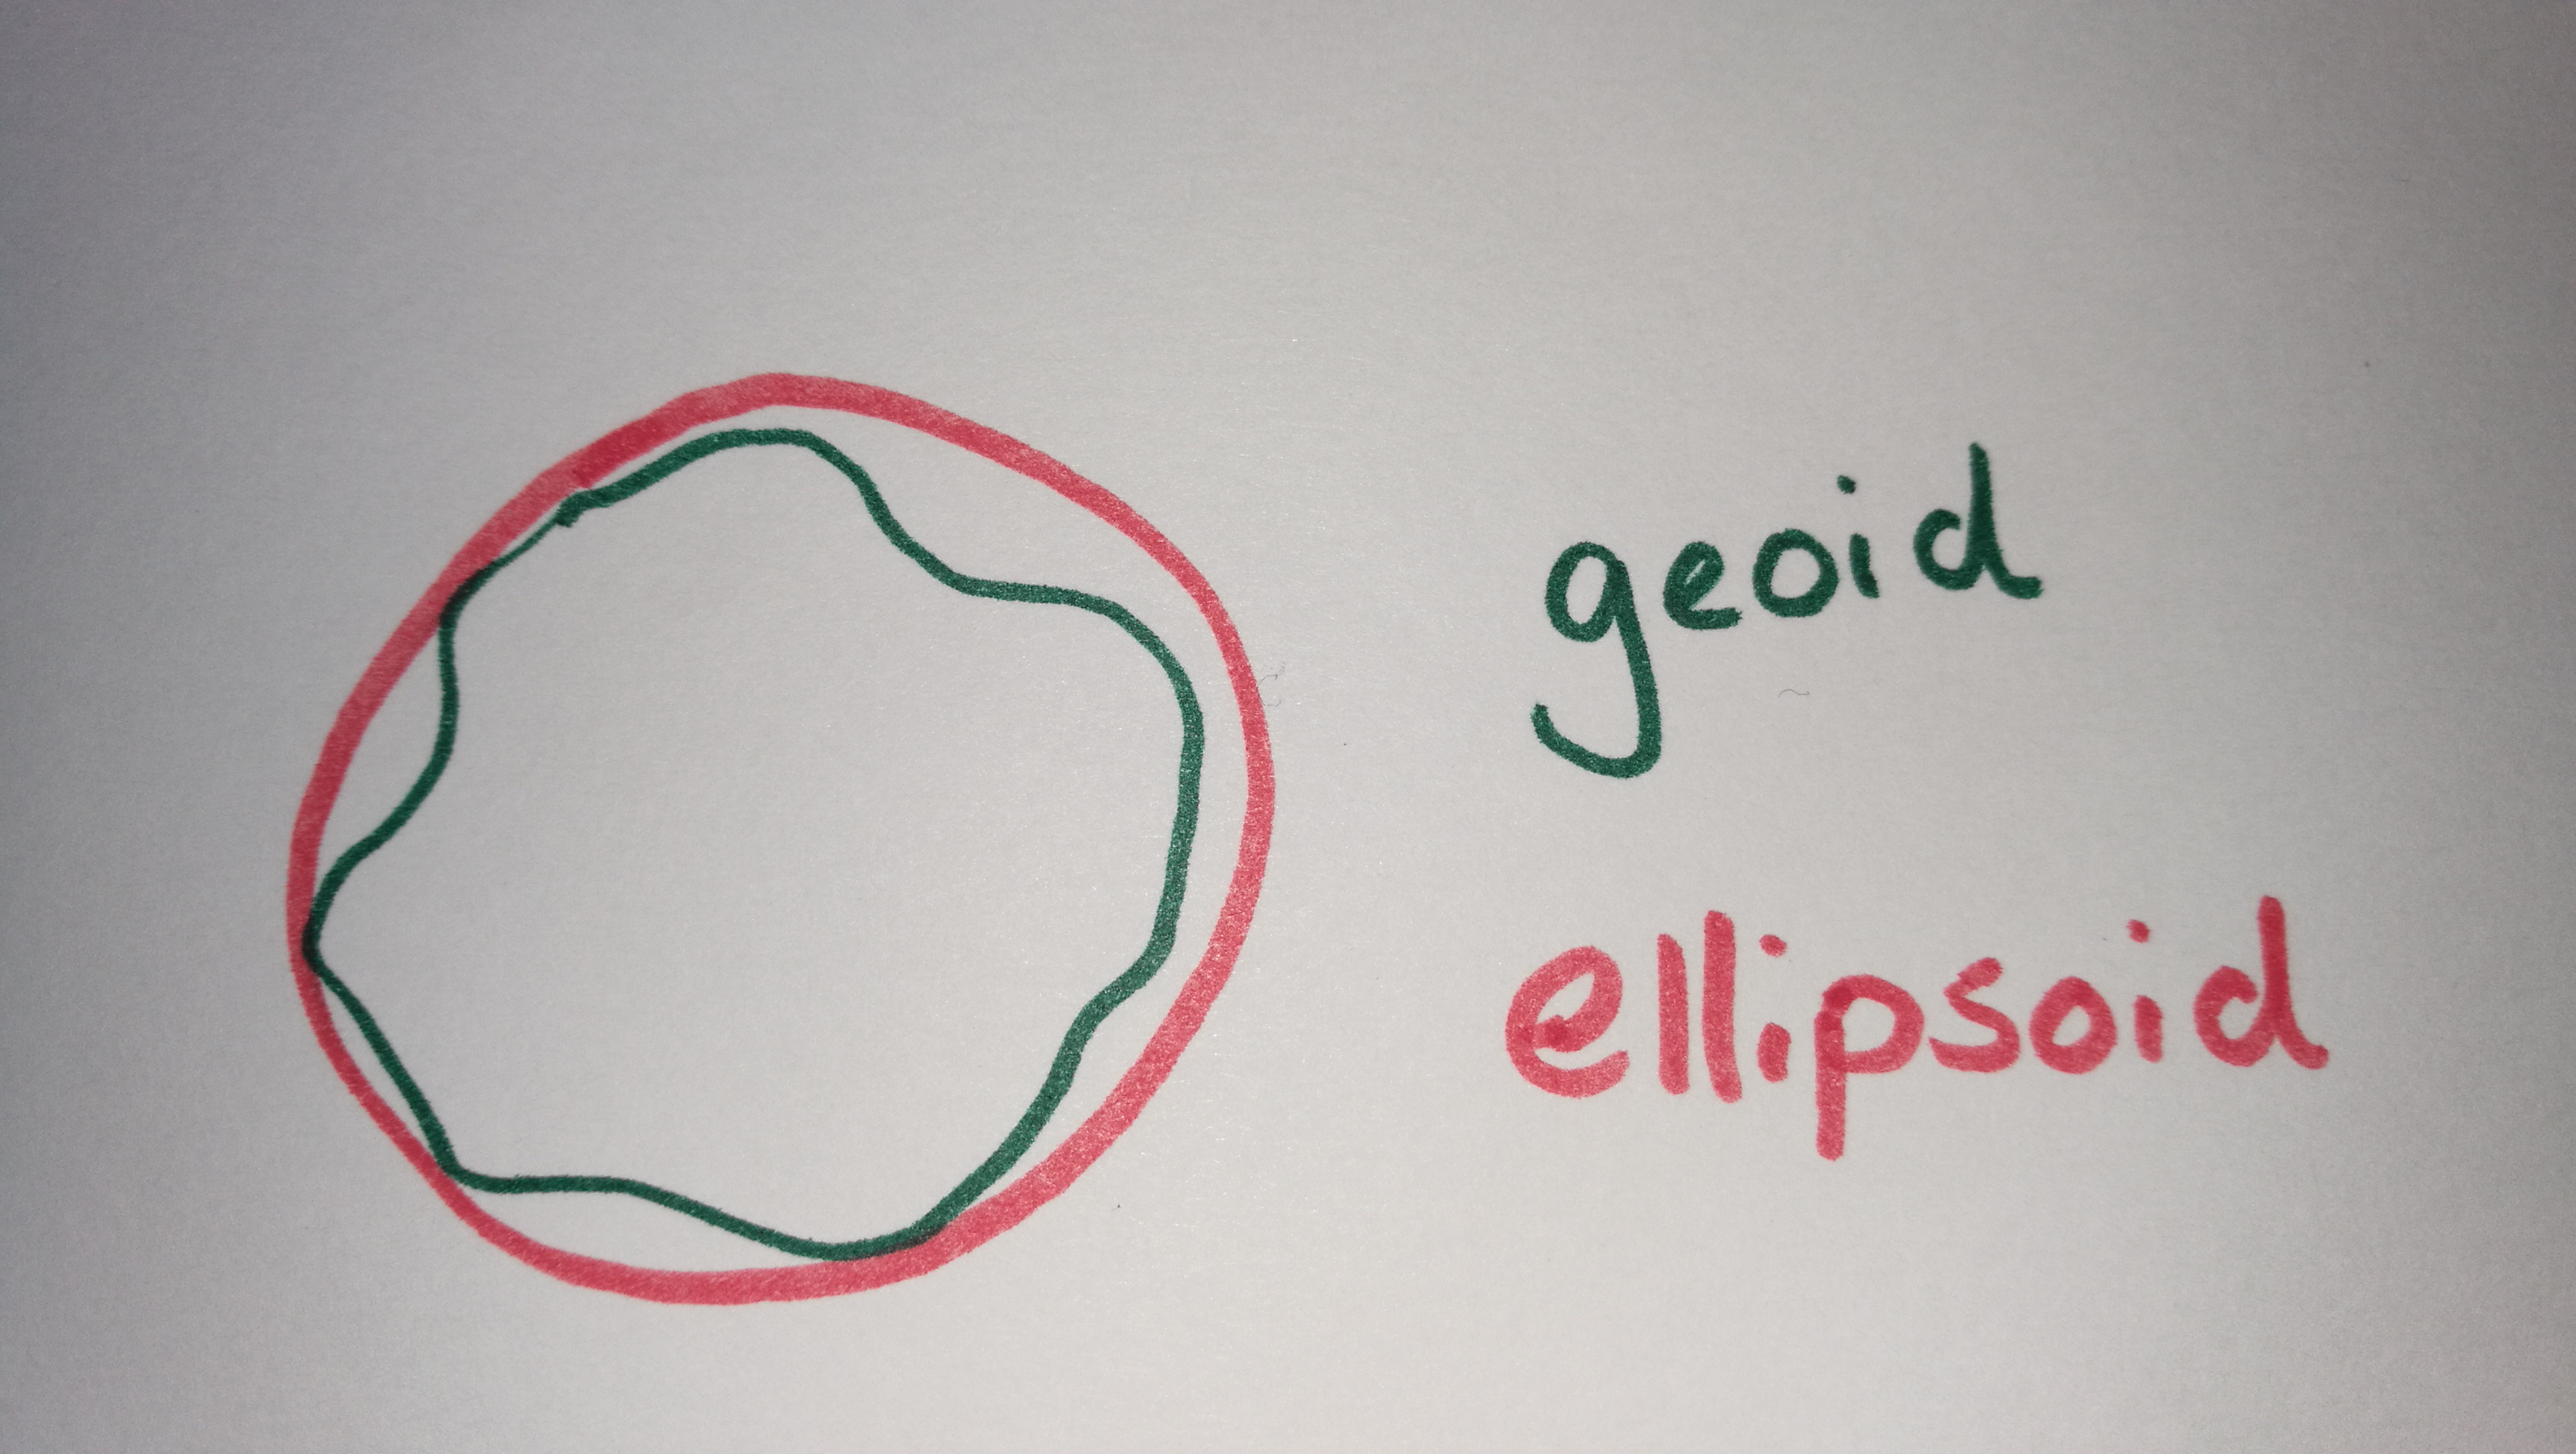
The real shape of the earth is too complex to be useful as a reference for measurement..
Geographic coordinate system
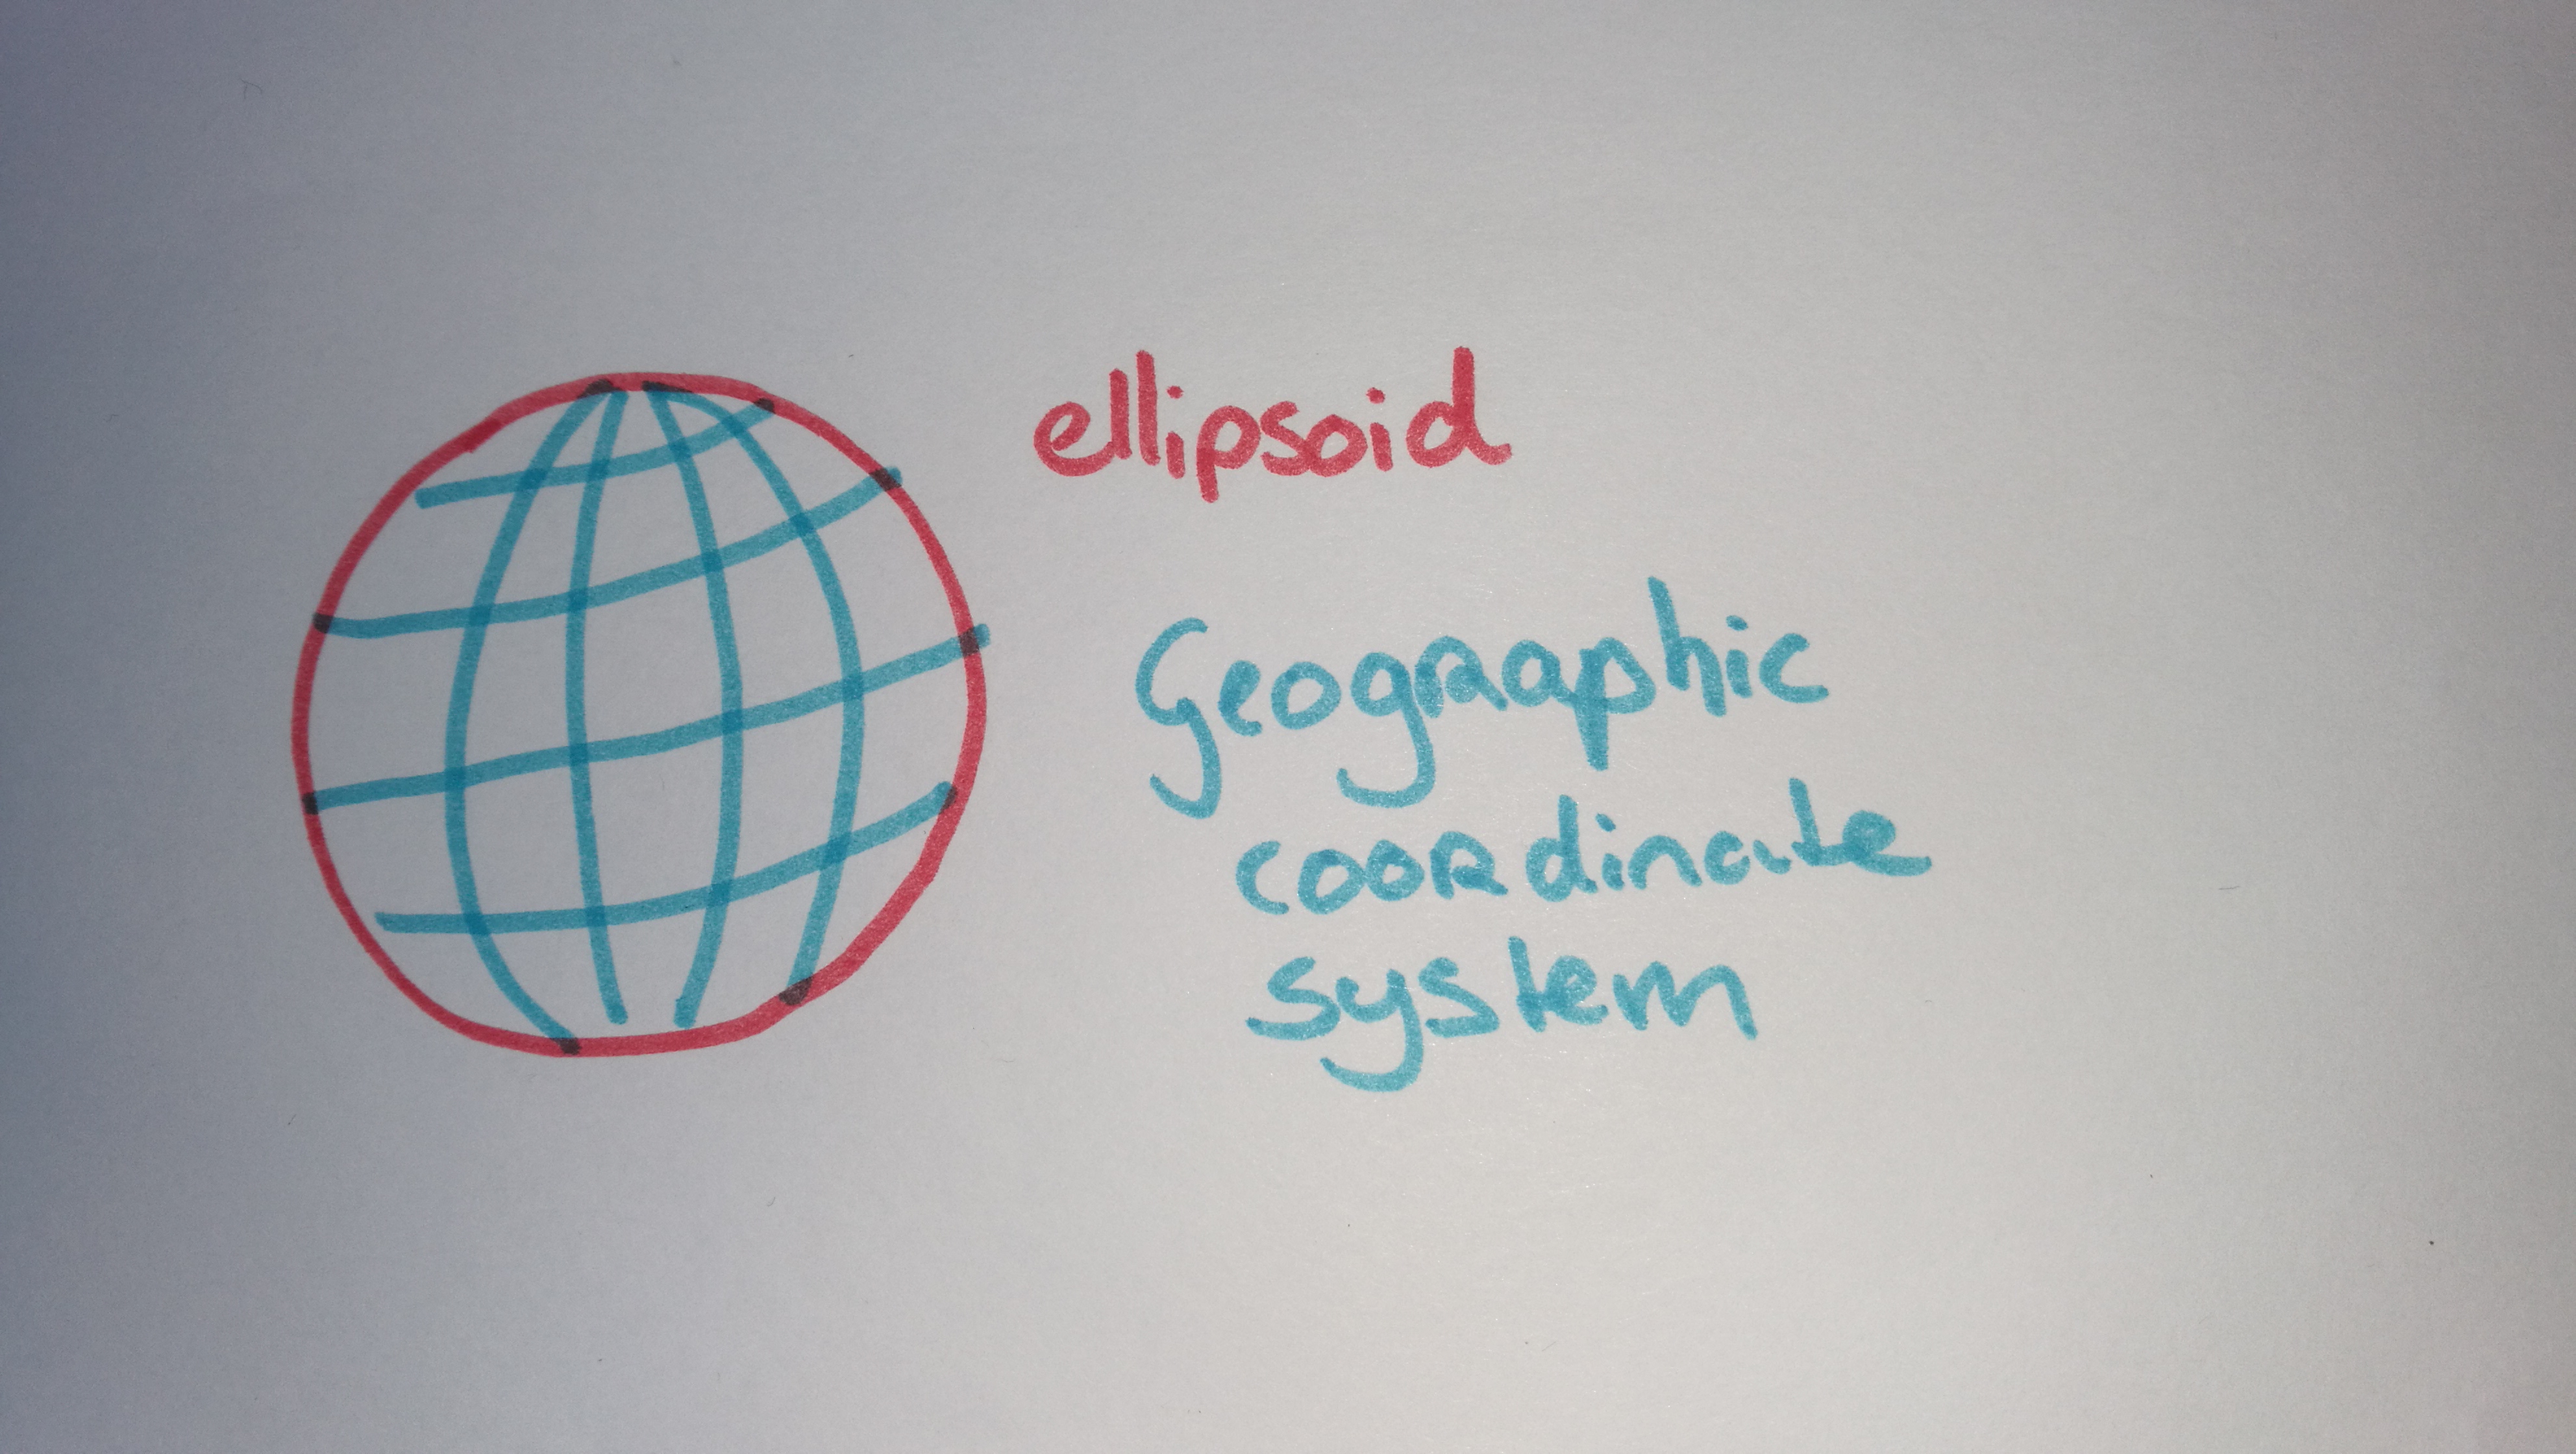
3D model
Longitude Latitude
Projected coordinate system
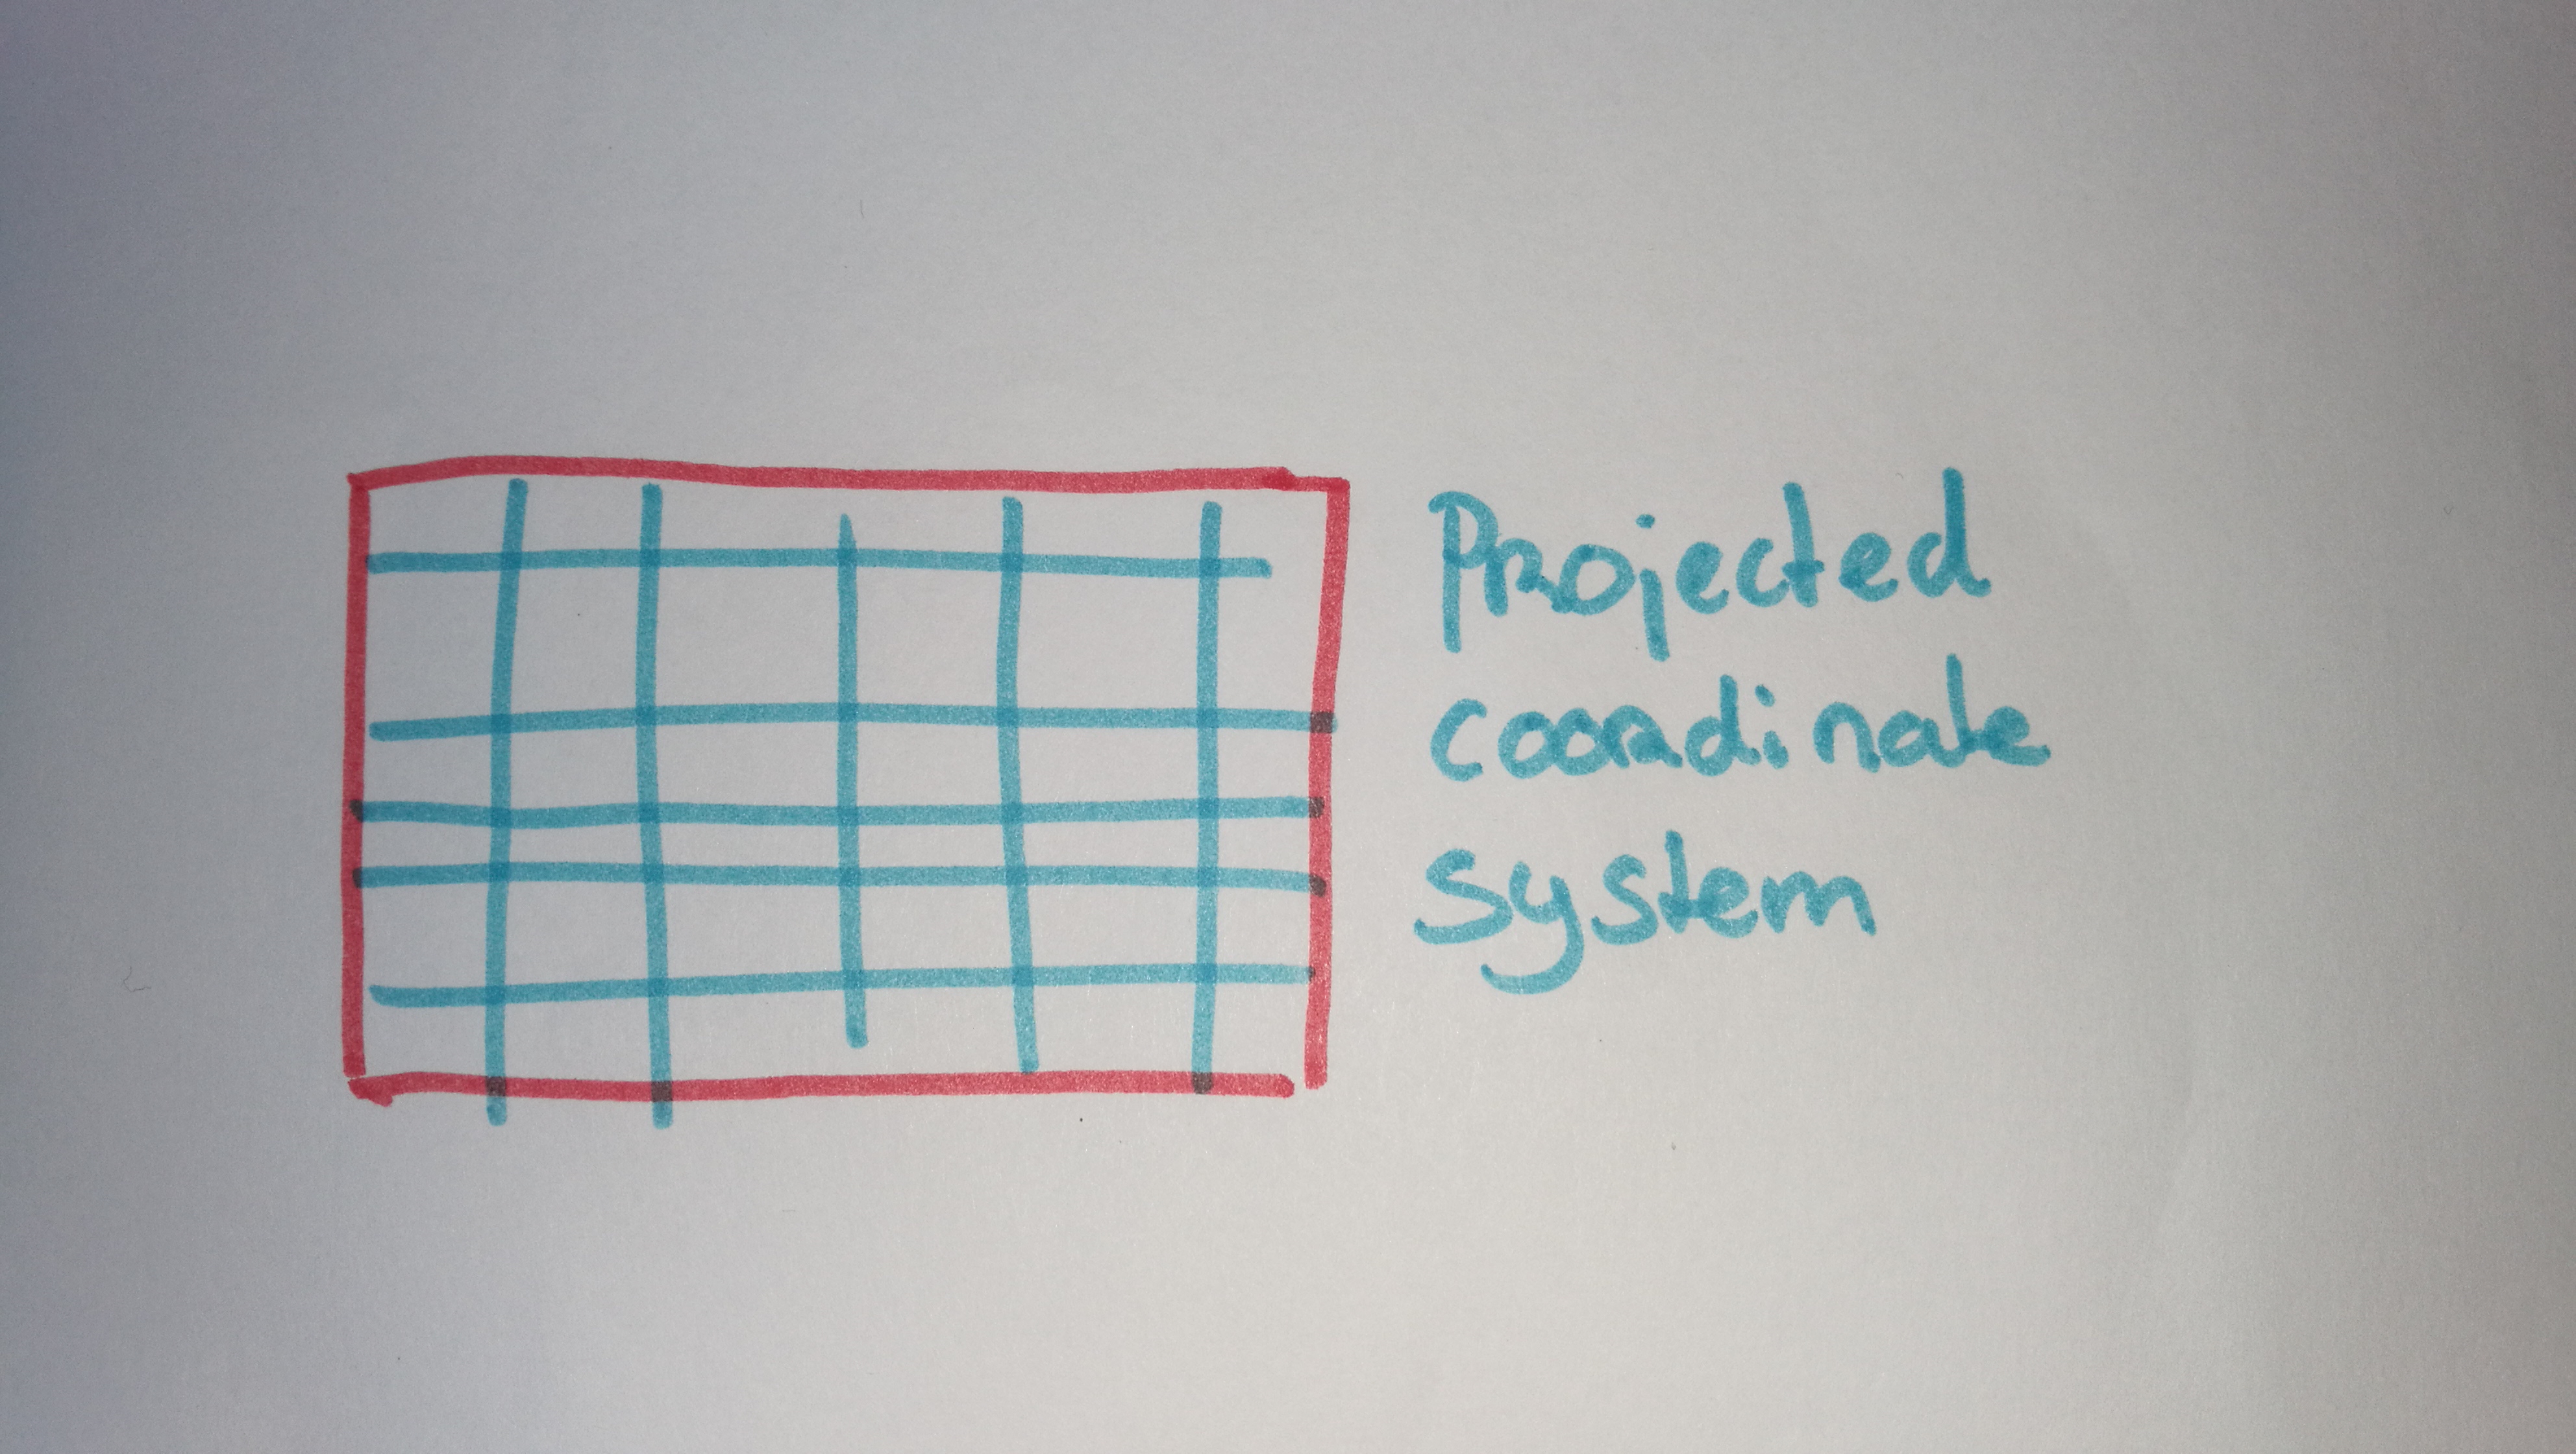
Mathematical projection / translation
2D
Geographic Coordinate System:
WGS84 EPSG:4326
Lon Lat in decimal degrees
GPS
Standard way to store most geodata for the Web:
                {
                "type": "Feature",
                "geometry": {
                    "type": "Point",
                    "coordinates": [5.2394137,52.0819662]
                },
                "properties": {
                    "name": "Hotel Theater Figi"
                }
}Projected Coordinate System:
Spherical/Web Mercator EPSG:3857
Square, scale not relevant, shapes important
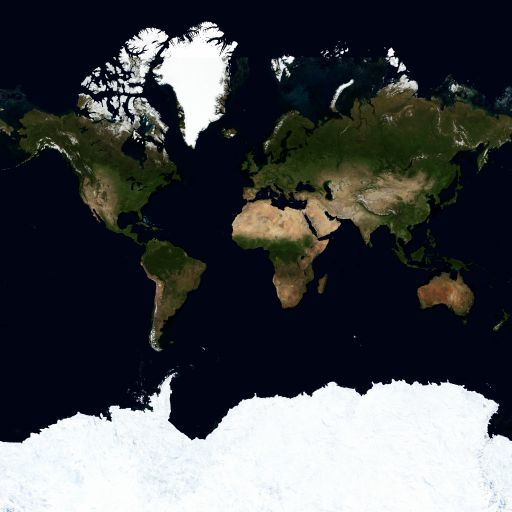
We store data in EPSG:4326, but display it in EPSG:3857!
Why is Mercator wrong?
Projected Coordinate System:
RD New EPSG:28992
Netherlands!

Geographic Coordinate System:
WGS84 EPSG:4326
Projected Coordinate System:
Web Mercator EPSG:3857
Projected Coordinate System:
RD New EPSG:28992
Tegel cache
Serveren
What is a web map?
Analogue paper maps
| Digital maps | VS | Web Maps |
|---|---|---|
| Data | Tiles, styles and servers | |
| On the computer | View in a browser | |
| Calculate, analyze | scroll, pan, zoom |
openstreetmap.org
google.com/maps
a little History
Digital maps
GIS software
GIS on the Web is not user friendly..
1996 Mapquest first with a web service!
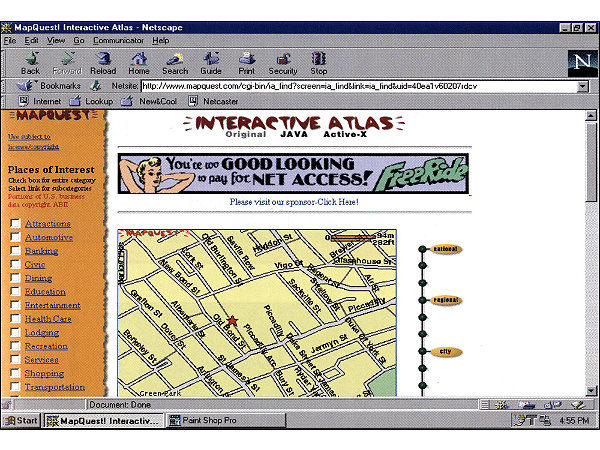
But really slow to load..
in 2004 Endoxon found a way for quick online mapping! map.search.ch
2005 Google Maps took over!
The solution?
Tiles!
Tiles
All tiles size 256x256 pixels
Placed in a grid, sharing boundaries
Seamless map
All these little tiles load way faster than one big map!
We call this slippy maps
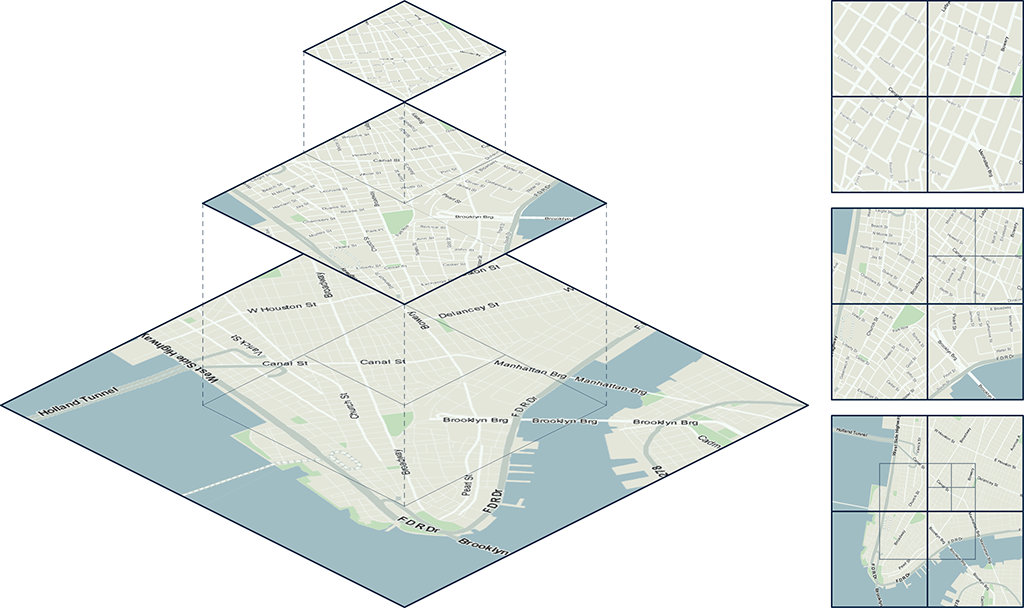
Zoom levels
Each zoom level has its own set of tiles!
Zoom level 0: 1 tile for the whole world.
Increases exponentially...
Zoom level 1: 4 tiles
Zoom level 2: 16 tiles
etc.
 Map with tile bounds
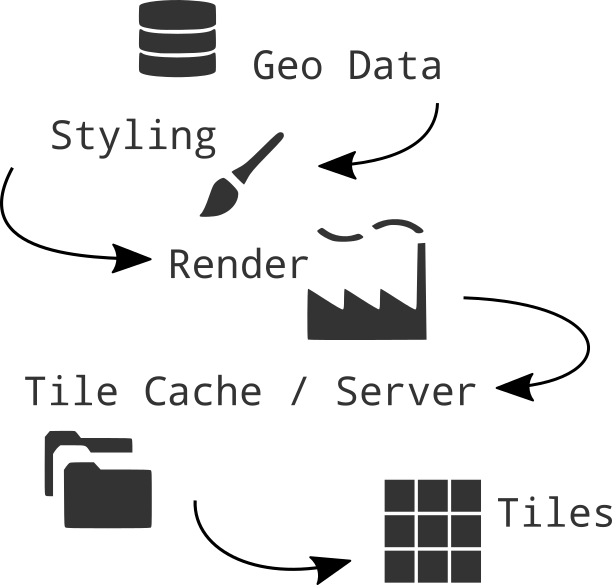
Styling & Serving tiles
Tiles are styled and rendered in advance
Tiles are just images on the web
http://tile.openstreetmap.org/5/16/10.png
/z/x/y

Serving data
Open Geospatial Consortium
The Open Geospatial Consortium (OGC) is an international not for profit organization committed to making quality open standards for the global geospatial community
WMS Web Map Service
WFS Web Feature Service
WMS
Map Server op een GeoDatabase
JPEG PNG
GetCapabilities
GetMap
GetLegendGraphic
GetFeatureInfo
WFS
XML > GML Geography Markup Language
GetFeature

Map Layers vs Data Layers!
Base Layer
Raster

Data Layer / Feature Layer
Vector
Summary
Web Map Building blocks
Data, styled, tiles, server:
Base Layer
Additional Data:
Vector Layers
Interface and Interaction
Zoom, panning, clicking etc.
Front-end libraries - JavaScript!
Puts it all together,
Tiles, content, interaction

Making a Web Page
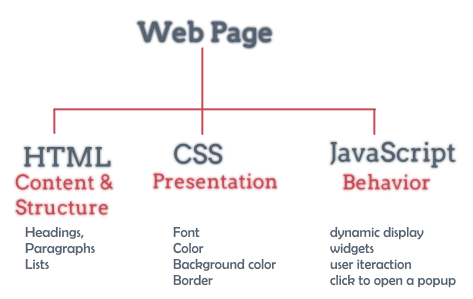
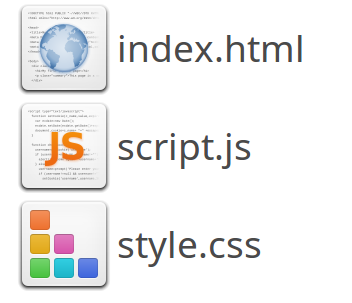
New to HTML & CSS?
Start with Making a web page
Or use Code Academy
JavaScript Library
Including a JavaScript library in your code is like copying and pasting someone else's code into yours. You have access to everything in that library.
In our case, it's a bunch of cool tools to make web maps and give them familiar functionality.
JavaScript Libraries for Mapping
Leaflet.js
An Open-Source JavaScript Library for Mobile-Friendly Interactive Maps
simplicity, performance and usability
What Leaflet does:
Quick simple web maps
Open-Source
Weighing about 38 KB of JS.
Has all the mapping features most developers ever need.
Can be extended with Plugins
Well documented
What Leaflet does not do:
Provide data for you.
Provide the basemap.
Its not GIS
Leaflet is a framework
ArcGIS JavaScript API
ESRI StoryMaps
R Shiny applicatie
Let's Map!
Everything is on Github
Github?!

Used for code.
Version control.
Sharing.
Documentation.
Use a good text-editor
Nodepad ++
With Syntax Highlighting!

The workshop
https://github.com/NieneB/mgi_workshop/wiki
follow the steps
www.github.com/NieneB/pzh_web_map
Web Frameworks
Leaflet en ArcGIS JS zijn geen Frameworks maar libraries
Framework
Makkelijk om een hele applicatie te ontwikkelen
Dynamische websites
multiple page
content management
Set of libraries
components
Meest bekende van het moment:
Front end JavaScript Frameworks
Angular
Vue
React
Ember
Backbone

There has never been more open data available than at this moment in time, and everyone from global NGOs to armchair hobbyists are using that data to create maps. [source]
Cartografie is geen niche meer:[source]
- Big data
- Massaconsumptie
- Open source sofware
- Open data
Web Mapping
- snelheid en schaalbaarheid
- Data-gestuurd
- Responsive ontwerp
- Gepersonaliseerd
Cartography is the new code.
 [source]
Vaardigheden
You need to be able to find, manipulate, and store spatial and non-spatial data. You need to be able to design a functional and attractive cartographic representation of that data as well as the UI controls to operate it. You need to be able to implement that design through code.[source: Axis Maps]
van Cartograaf naar ..
Data-analist / GIS-specialist
Full-stack ontwikkelaar
Interactie-ontwerper (IX)
User Experience-ontwerpter (UX)
Meer info en workshops?
My lists of
interesting links, workshops, presentations and background information:
for webmapping in general and d3 & Leaflet
Check mijn github: github.com/NieneB
Dankjewel!
Niene Boeijen
niene@webmapper.net