Gast college Breda
Niene Boeijen

Propedeuse Art Academy
MSc Geo Information Science
Internship Geo Web Visualization
Maptime Amsterdam & Utrecht
Web Cartographer
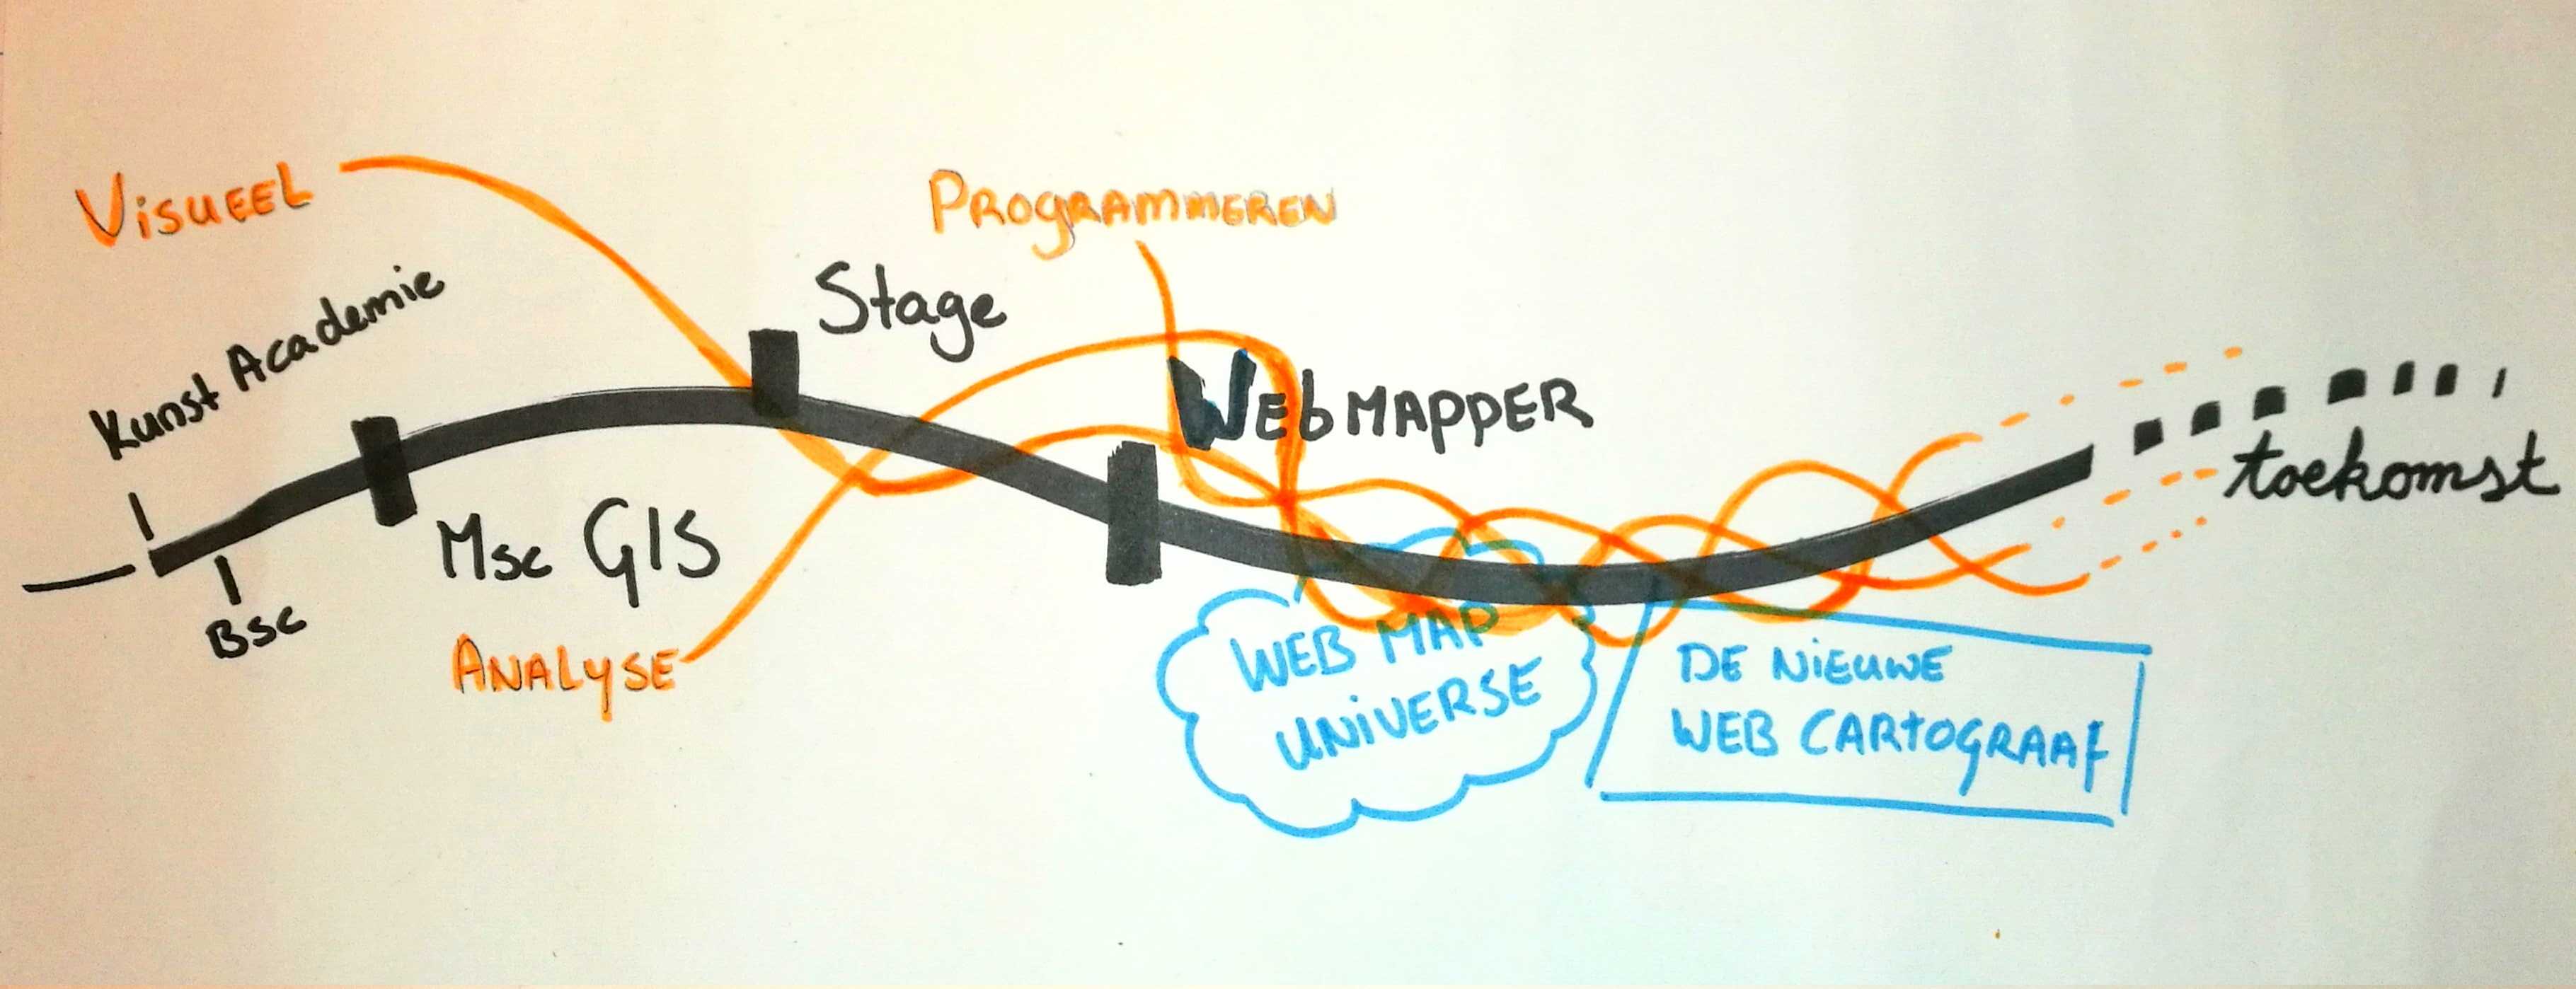
Webmapper
Utrecht, the Netherlands
Data - Design - Technology
Webmapper
Utrecht, the Netherlands
We make interactive maps & geo data visualizations
Our expertise is open {source; data; standards}
We combine cartography with web technology
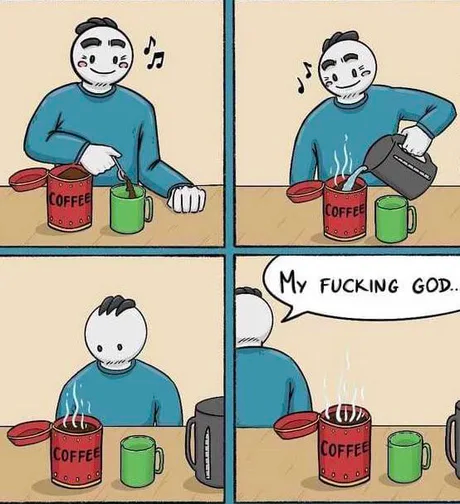
Bij Webmapper
Elke dag programmeren..
& creatief bezig zijn
What I make:
NieneB.nl
Inspireren tot het meer gebruiken van GIS!?
Wat willen jullie weten?
-
Wat is GIS voor jullie?
-
Wanneer zou je GIS gebruiken?
-
Wanneer niet?
Let's talk maps!
"Everything is related to everything else, but near things are more related than distant things"Tobler's first law of geography
Maps = Collection of Geo data
Maps organize complex data about the environment.
Reveal patterns and relationships.
Maps allow us to communicate about location using a common framework
Power of Maps
Maps make sense of things. They lend order to complex environments, and they reveal patterns and relationships.
Information may be infinite, however... The organization of information is finite as it can only be organized by LATCH:
- Location
- Alphabet
- Time
- Category
- Hierarchy
Richard Saul Wurman, 1996
millions of bits of information on a single page. No other method for the display of statisial information is so powerfull.
Edward R. Tufte
Power of Maps
.. why so many relate to maps and geography is that we have no choice but to think and see spatially.
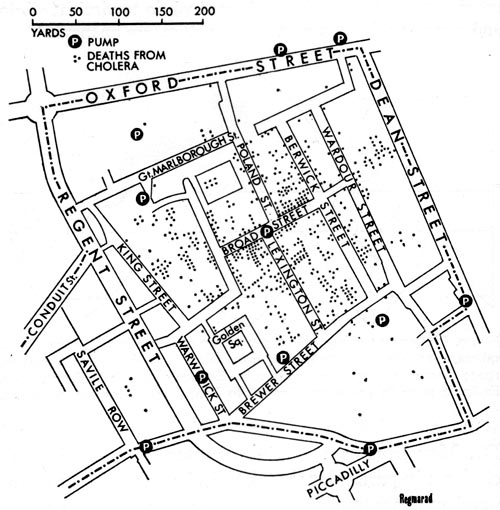
1854
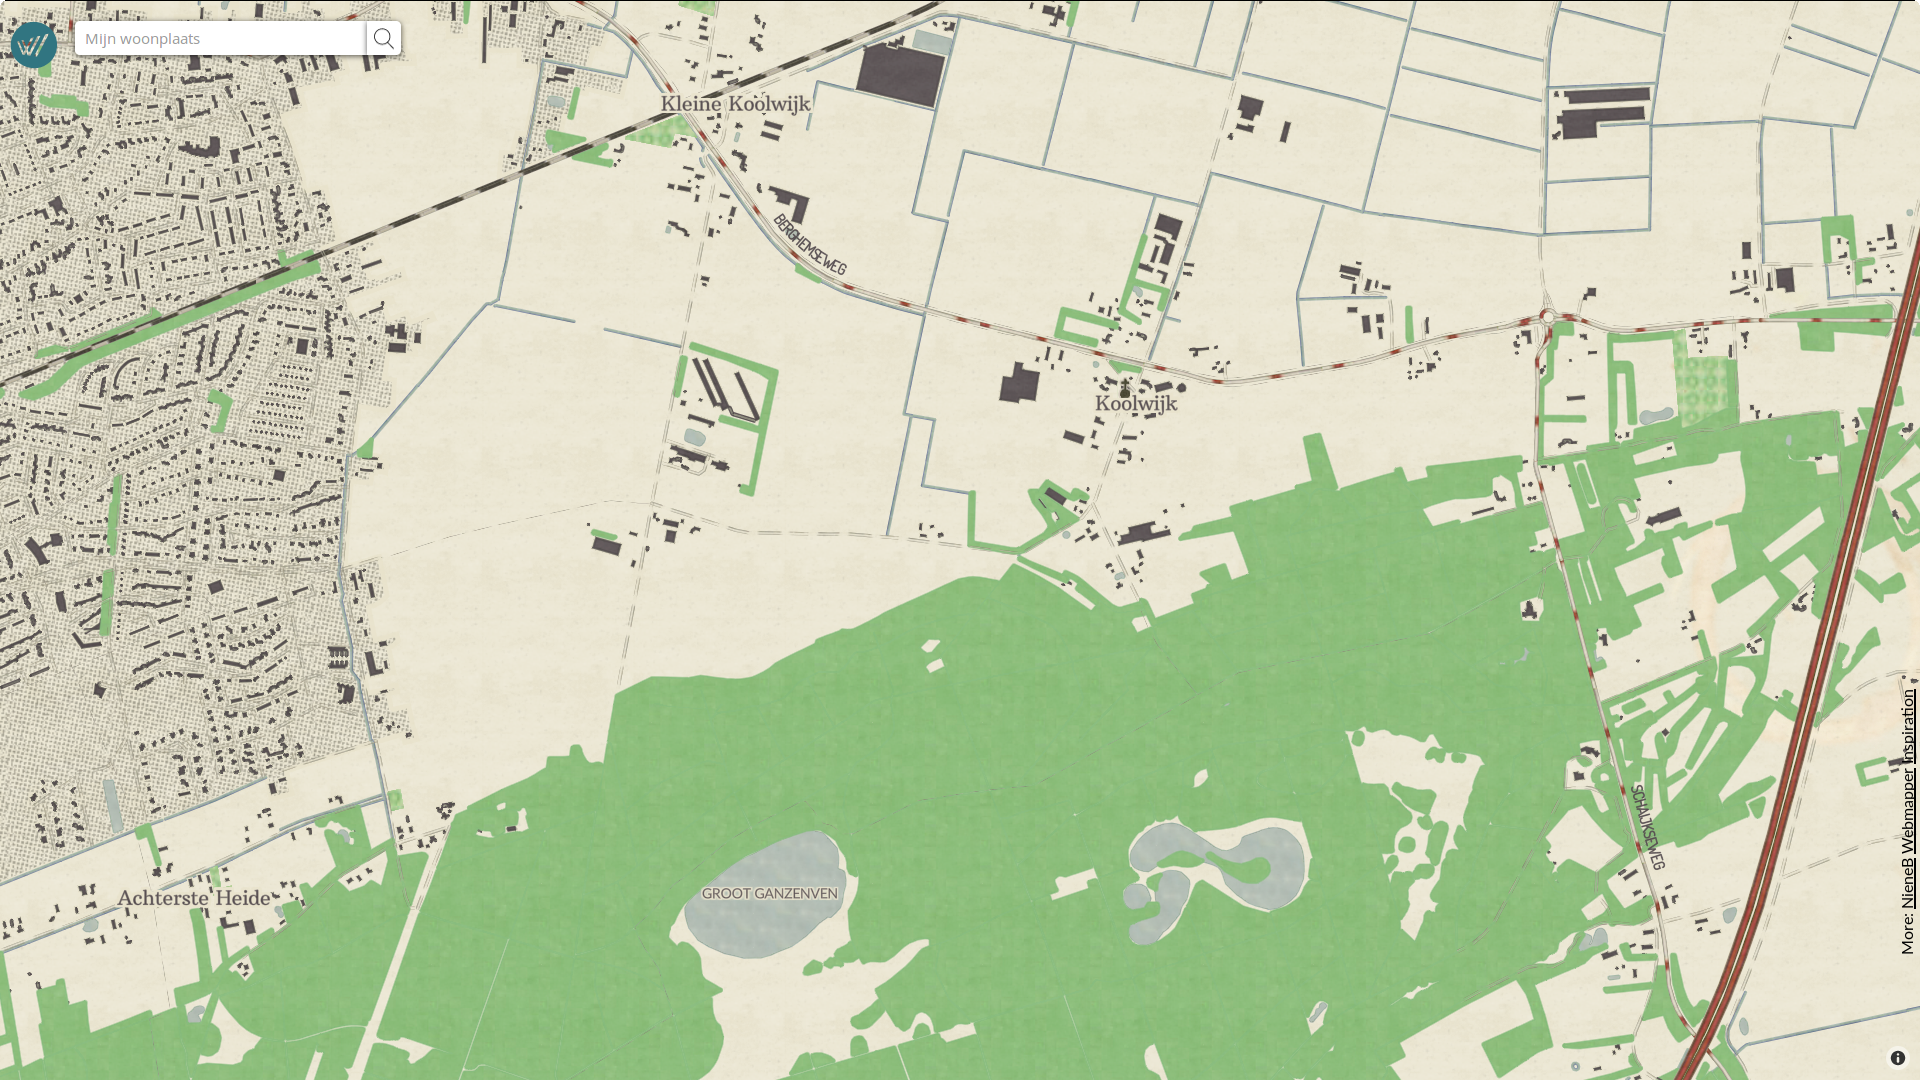
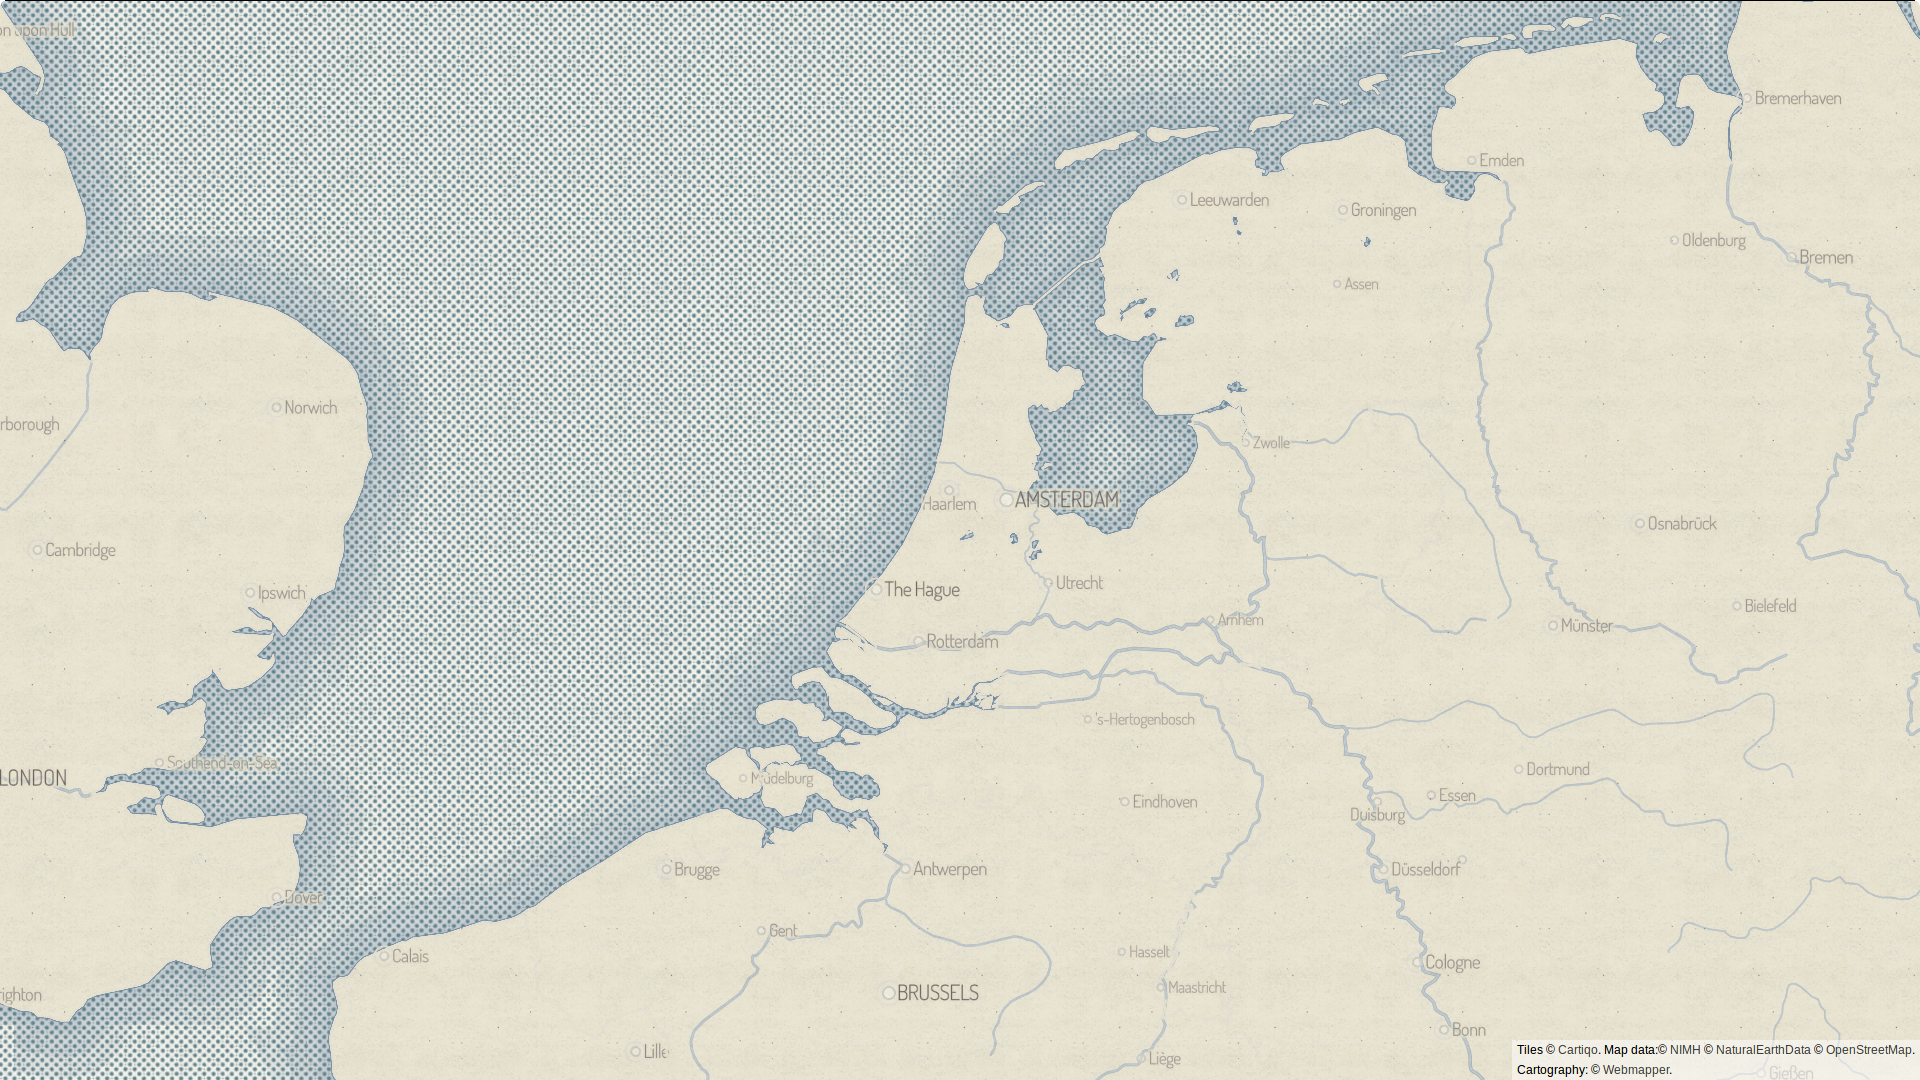
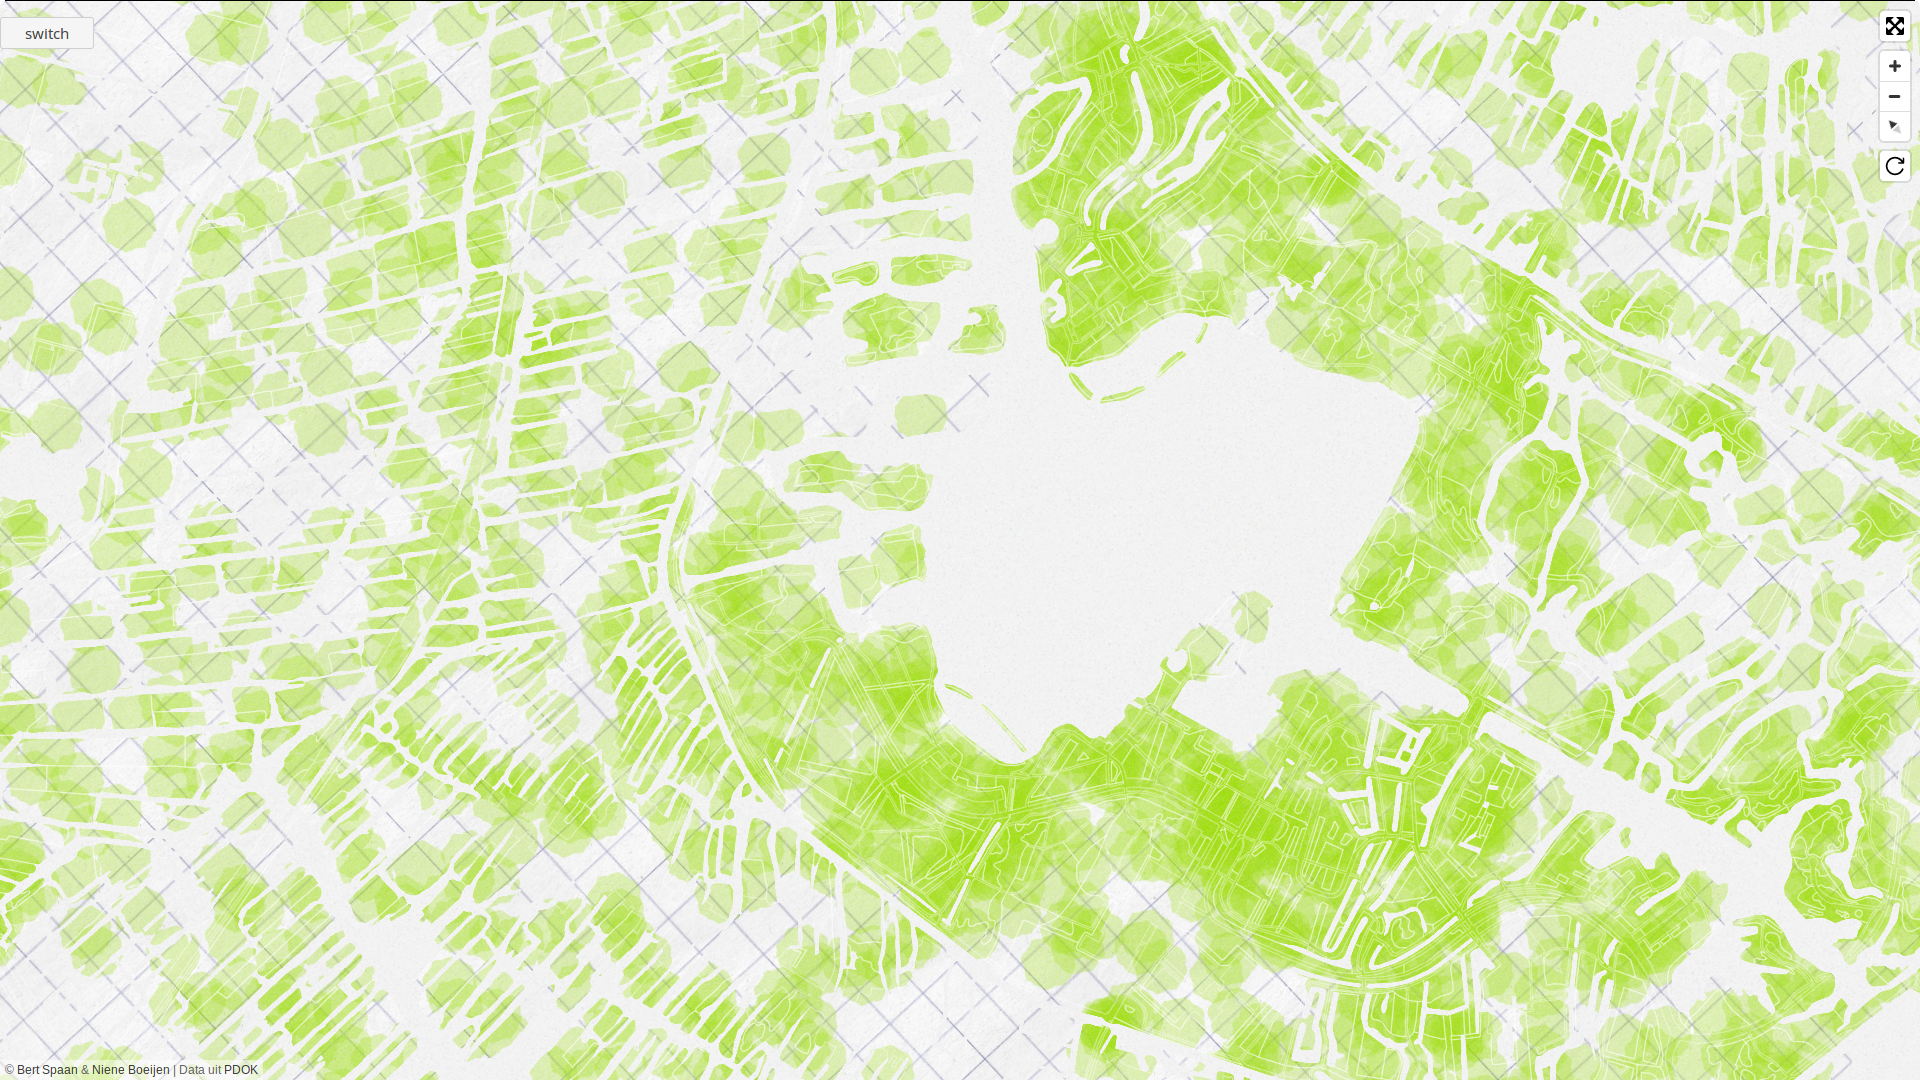
Power of Beautiful maps
They stimulate both sides of our brain: the right side that’s intuitive and aesthetic, and the left side that’s rational and analytical. Maps are this wonderful combination of both.
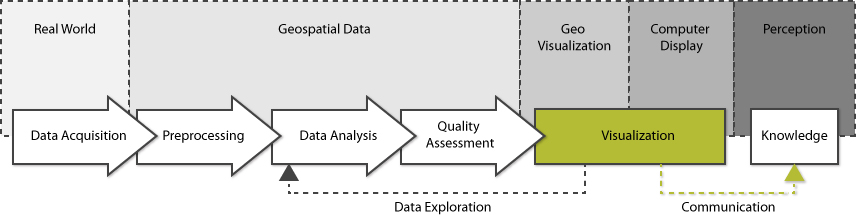
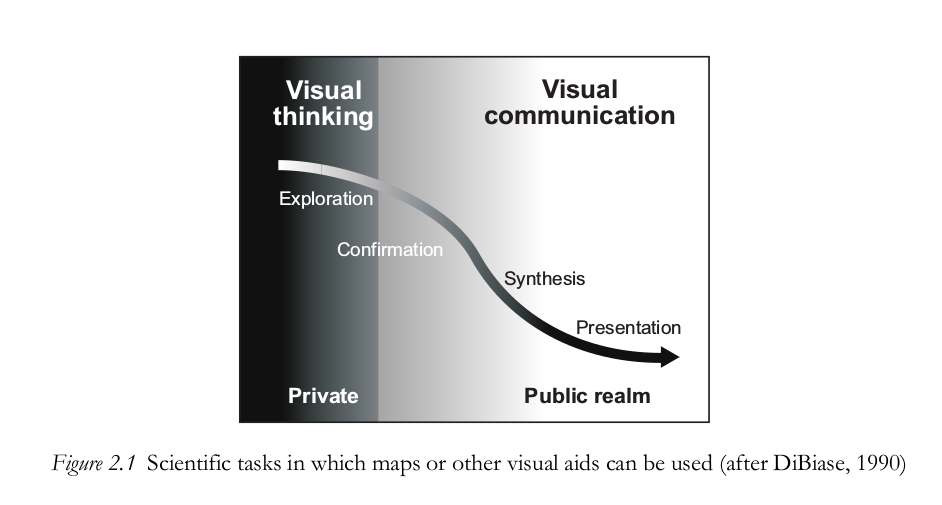
Data Analyse
Exploratie & communicatie
There has never been more open data available than at this moment in time, and everyone from global NGOs to armchair hobbyists are using that data to create maps. [source]
Cartografie & GIS is geen niche meer:
- Big data
- Massaconsumptie
- Open source sofware
- Open data
"IF you torture the data long enough, it will confess to anything."
Ronald Coase
Whishfull thinking
Kennis is data maar data is nog geen kennis
Statestiek
Blijf critisch!
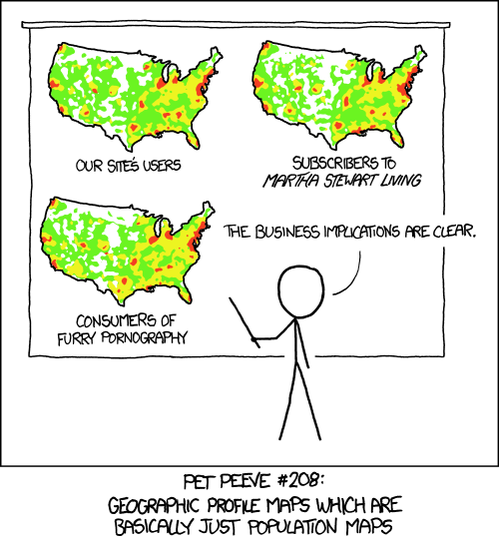
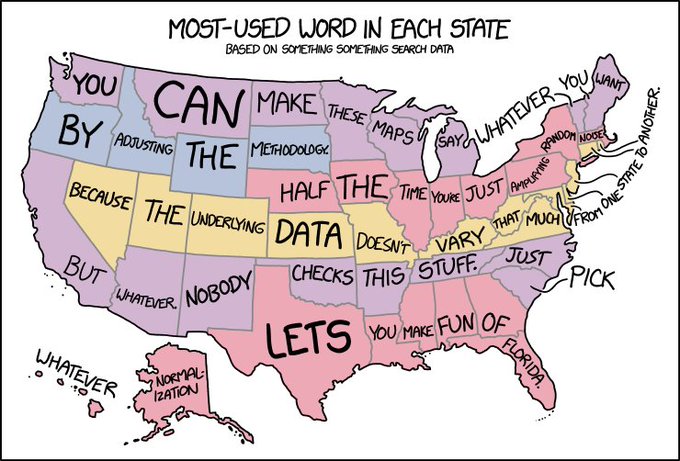
Data valkuilen..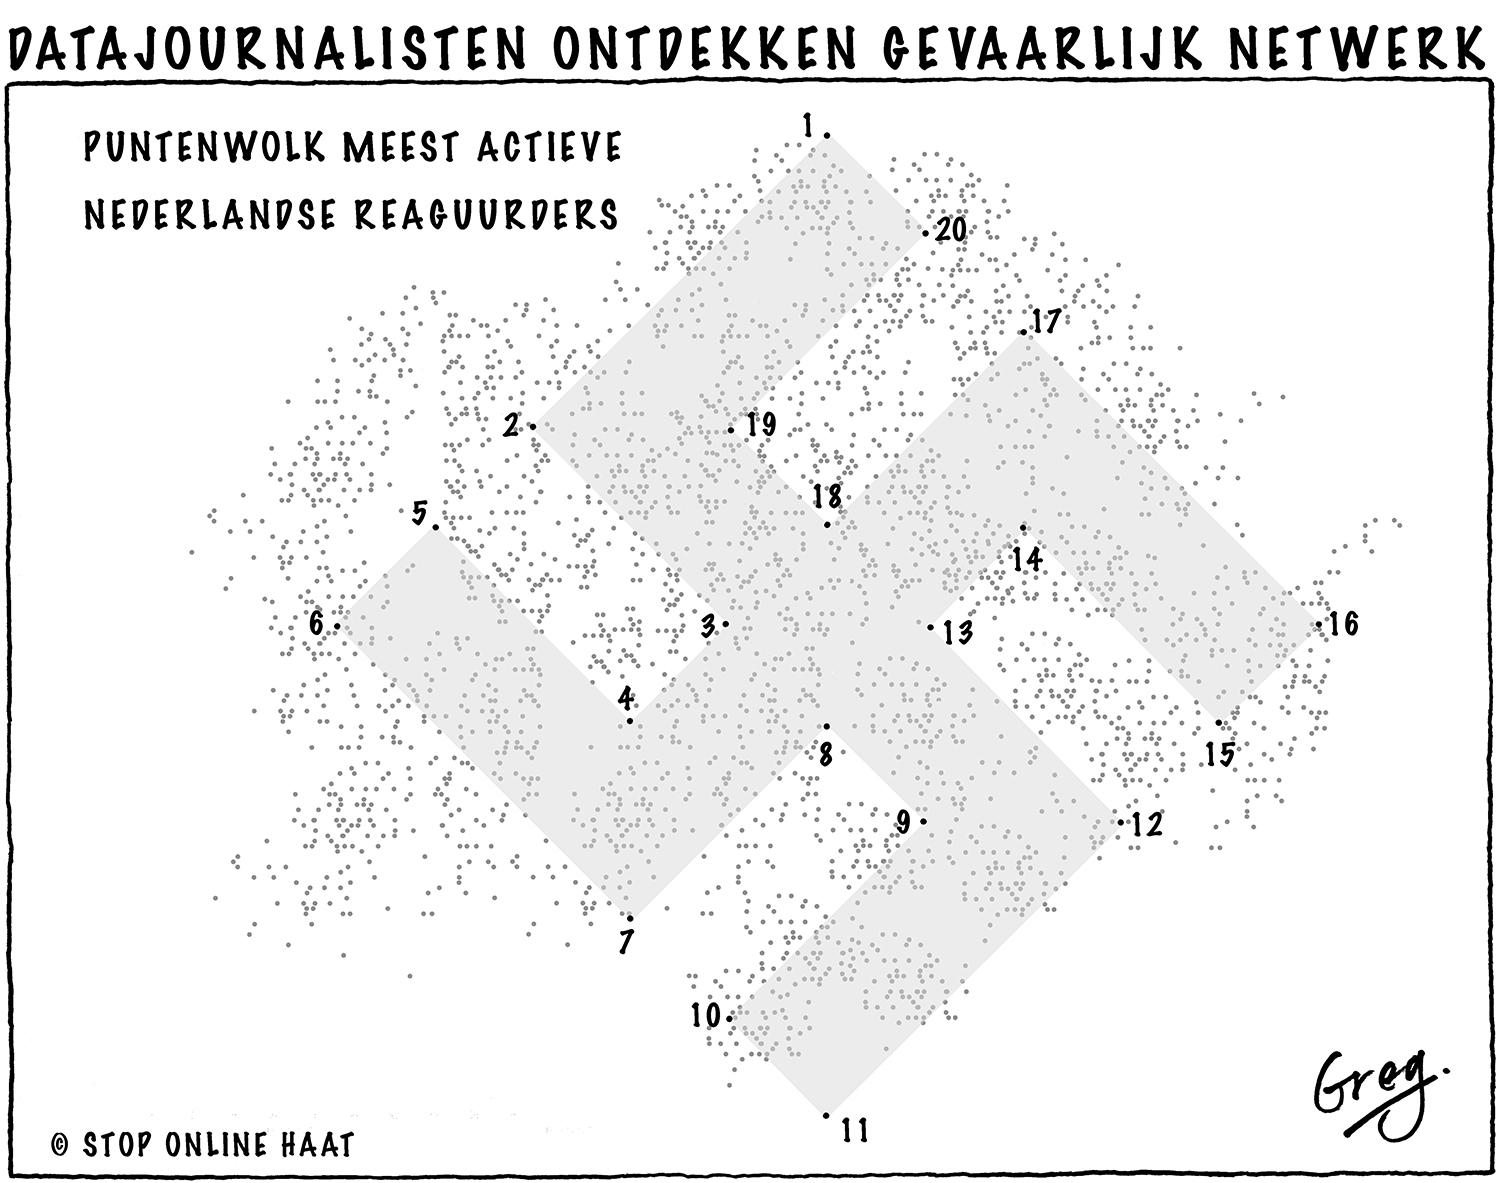
Liegen met kaarten
het is heel makkelijk..
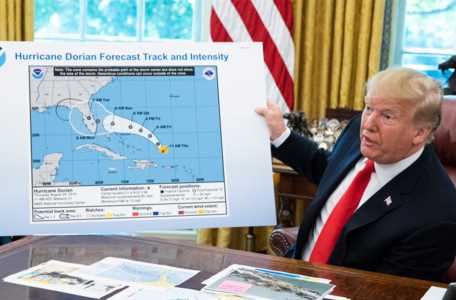
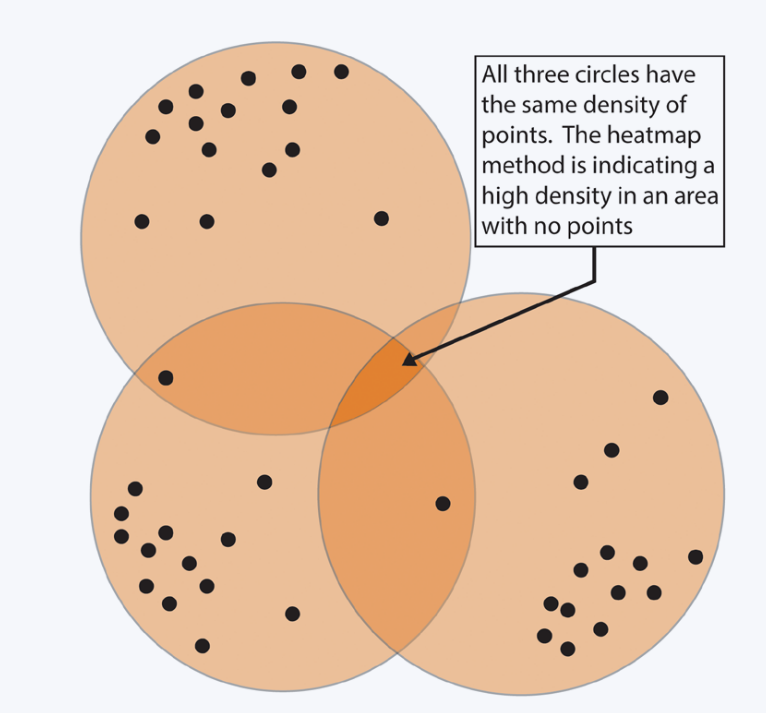
Valkuilen cartografie
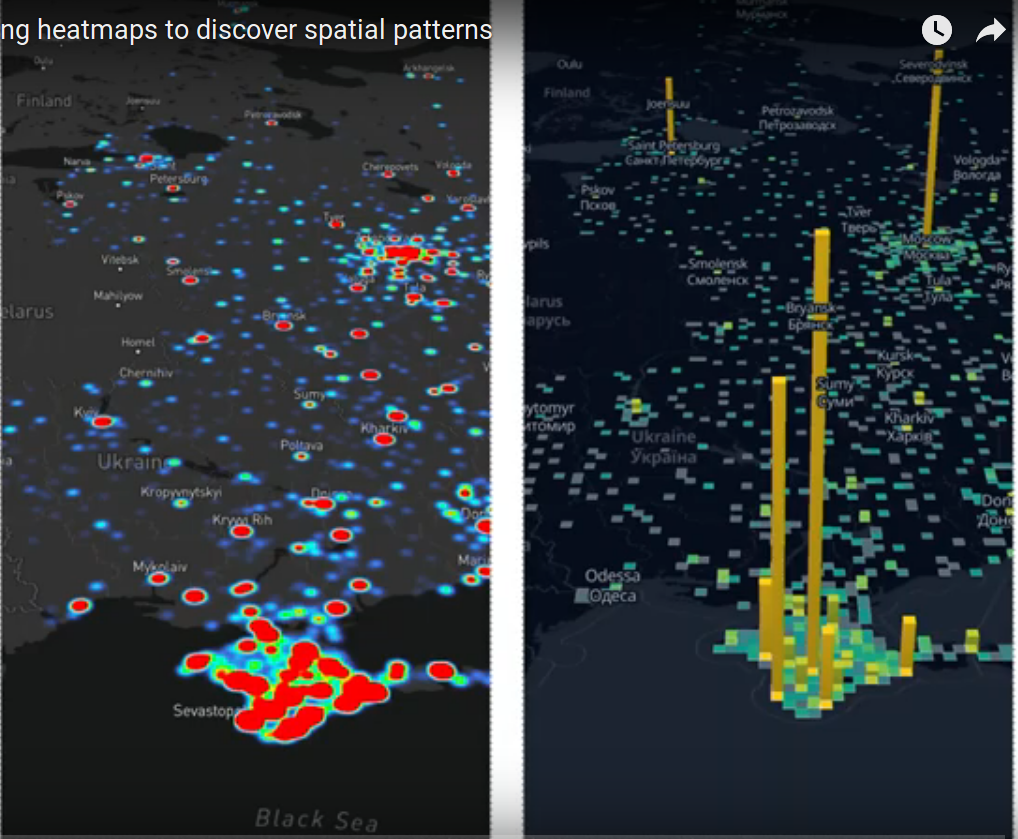
Heatmaps
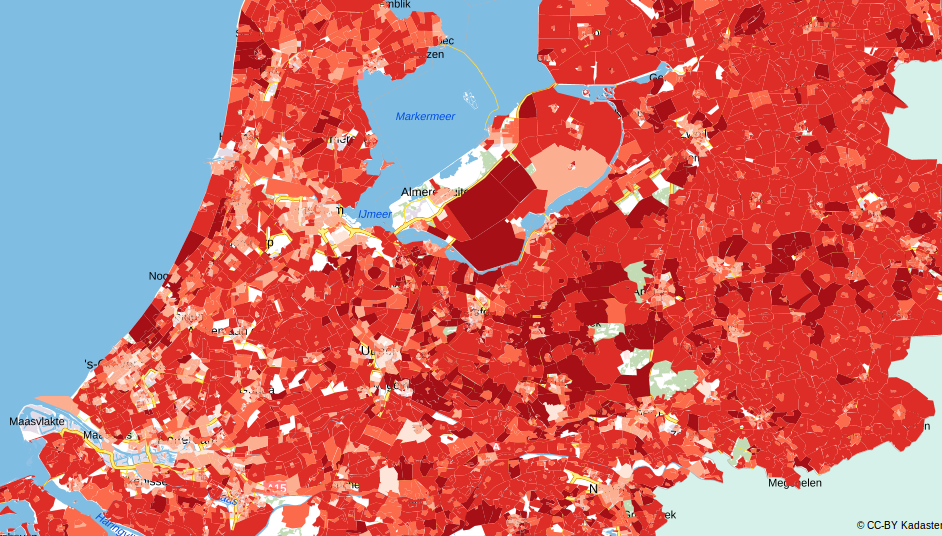 Voorbeeld
Data gedreven visualisaties
Interactief en programmeren
Berlins Neue skyline BAG 3DJenks natural breaks optimization
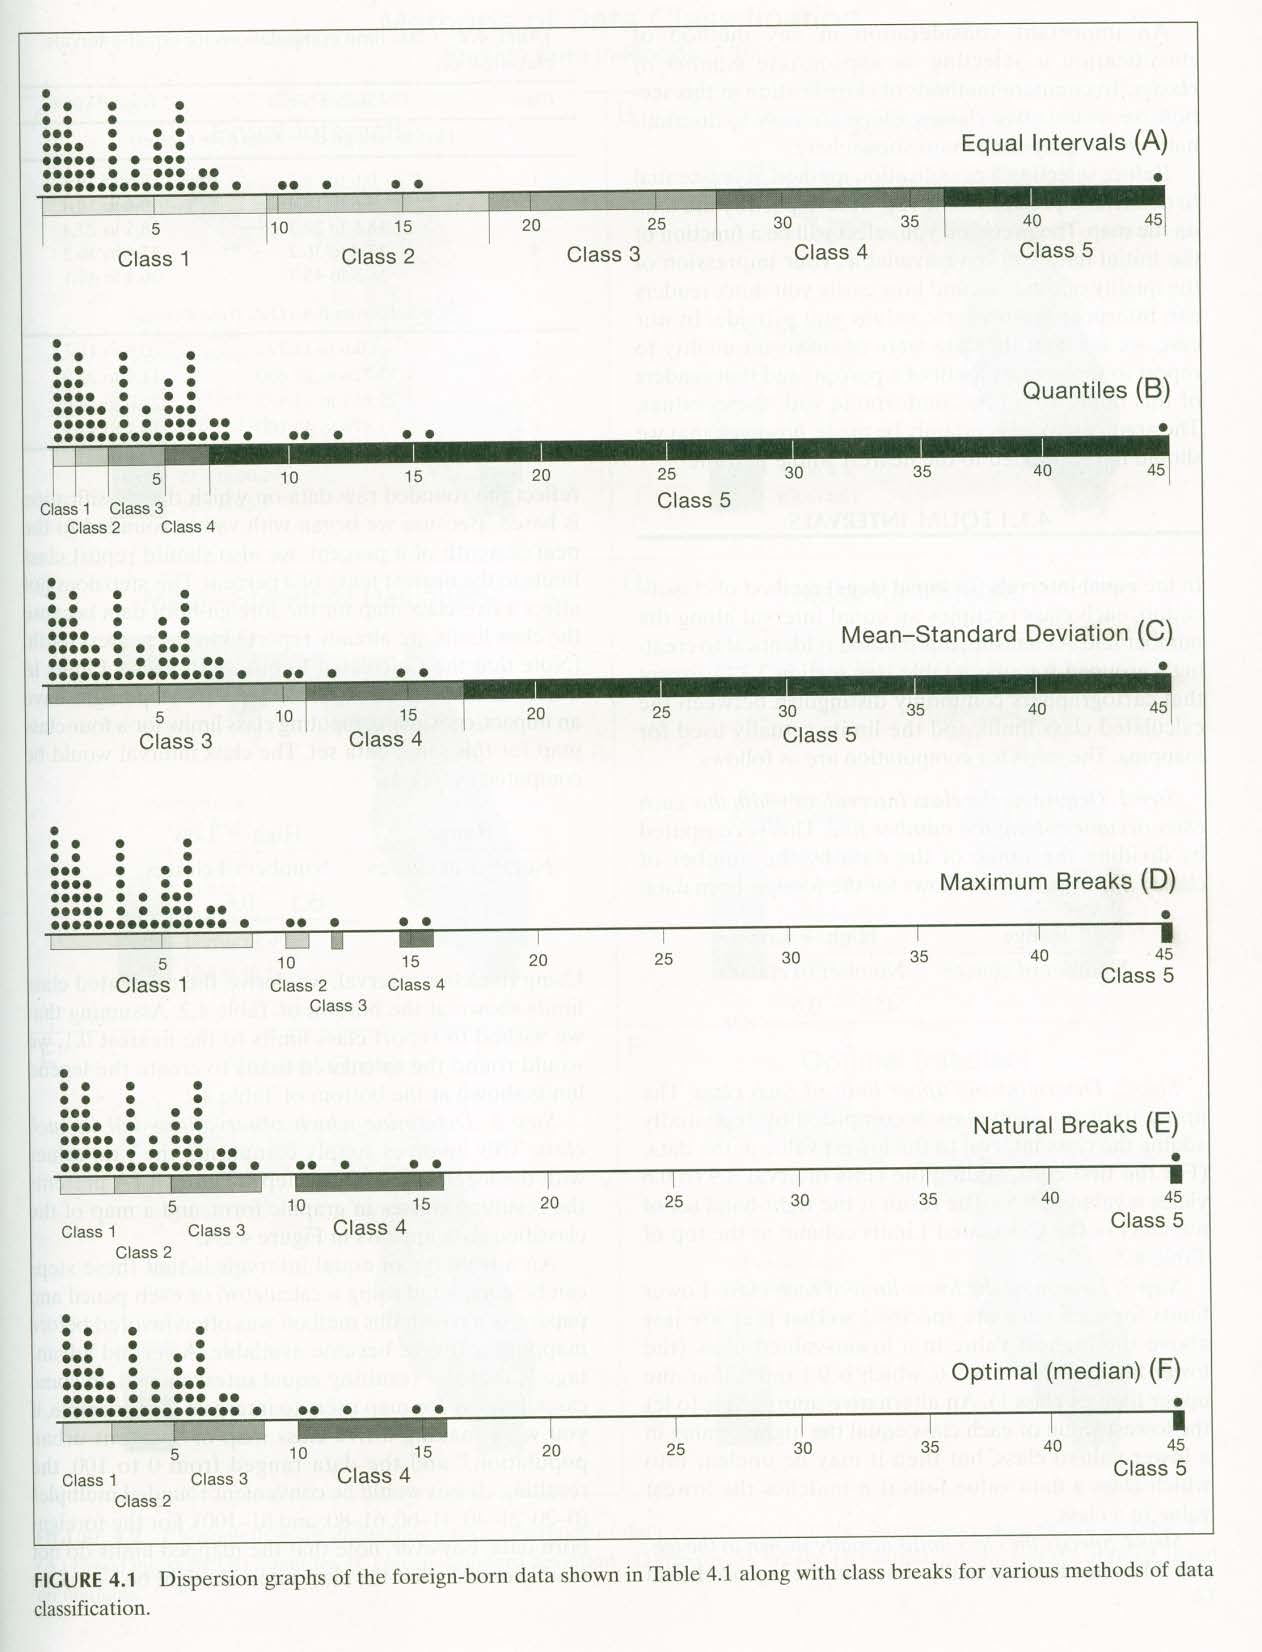
1.83 - 2.68 - 4.93 - 7.28 - 9.13 - 14.96 - 21.13 - 40.86 - 68.59 - 125.71 - 332.12 2.18 - 7.53 - 7.60 - 9.22 - 12.35 - 14.72 - 15.53 - 24.88 - 31.06 - 61.72
Analyse is key voor de visualisatie
Visualisatie is key voor de analyse
Hoe dan?
Data
PDOK Publieke dienstverlening op de kaart
CBS Centraal Burea voor statestiek
NGR Nationaal Geo Register
Dataplatform.nl Gemeenten Provincie portalen
OSM, Natureal earth
Het is niet makkelijk...!
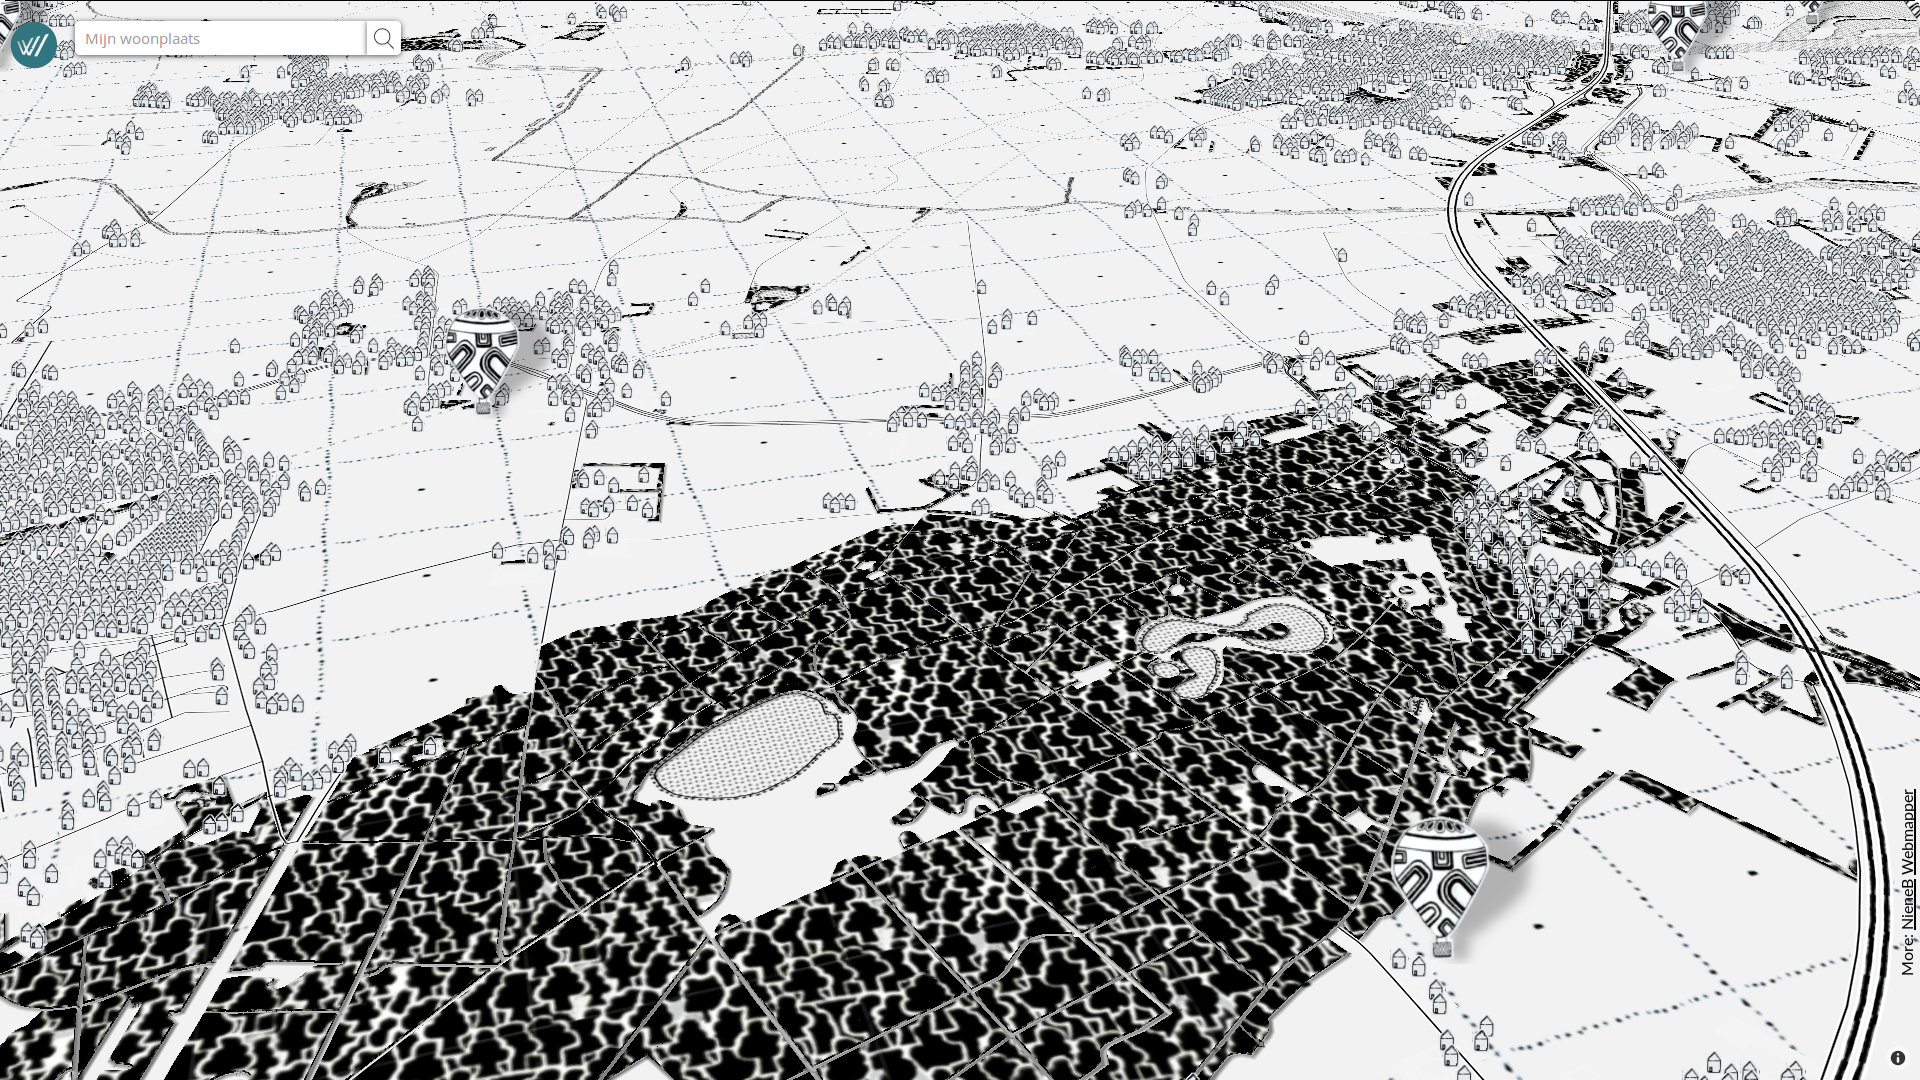
3D & Augmented reality
tijd voor een DEMO
-
Wat is GIS voor jullie?
-
Wanneer zou je GIS gebruiken?
-
Wanneer niet?
- 3D en Augmented reality tools, Wat vinden jullie?
Online workshops
Thank you!
| niene@webmapper.net |
| @BNiene |
| NieneB |
| NieneB.nl |
| Niene Boeijen |
| volvo_343_dl_1980 |